HOT TOPICS LIST
- MACD
- Fibonacci
- RSI
- Gann
- ADXR
- Stochastics
- Volume
- Triangles
- Futures
- Cycles
- Volatility
- ZIGZAG
- MESA
- Retracement
- Aroon
INDICATORS LIST
LIST OF TOPICS
PRINT THIS ARTICLE
by Chris Manuell
The Nikkei has had the weight of a sumo wrestler on its shoulders in 2004 with a strong yen and high oil prices. Could 2005 provide some relief?
Position: N/A
Chris Manuell
Chris Manuell spent 7 years as a futures sales/trader for a large investment bank and more recently as a technical analyst for an independent research company. He has a bachelor of economics and graduate diploma in applied finance & investment. Currently enrolled in the CMT program with the MTA.
PRINT THIS ARTICLE
TECHNICAL ANALYSIS
Nikkei Poised For A Powerful Move
12/10/04 08:21:44 AMby Chris Manuell
The Nikkei has had the weight of a sumo wrestler on its shoulders in 2004 with a strong yen and high oil prices. Could 2005 provide some relief?
Position: N/A
| Conventional wisdom suggests that the Nikkei will remain sluggish in the face of rising oil prices and a rising yen. This guideline appears to have unfolded albeit sporadically this year, with the Nikkei displaying a choppy trading range following the strong rally in 2003. Will this theme persist into 2005? Will the Nikkei capitulate under this two-pronged attack and diverge from the recent strength in global equity indexes? Or will the recent correction in both oil and yen be sustained into the New Year, allowing the Nikkei to resume its 2003 rally? |
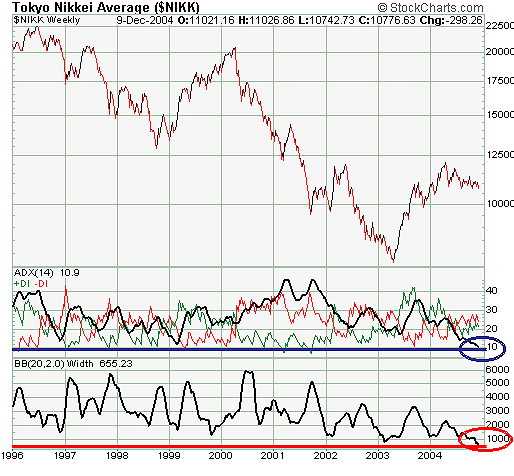
| The current low volatility in the Nikkei can be demonstrated through the converging trading range on the bar charts, but the technical indicators demonstrate a more objective assessment. The average directional movement index (ADX) can evaluate the strength of the trend and a low reading; a reading below 20 is generally considered a weak trend and is indicative of a directionless market. Strong trends tend to commence when the ADX rises from a low base. The weekly ADX on the Nikkei is at an extreme low, which heightens the probability that a sharp move is imminent. Bollinger Bands gauge volatility by inserting two trading bands around a moving average. The trading bands are placed two standard deviations above and below the moving average. The bands expand and contract, based on the recent movement of the moving average. When the distance between the bands narrows too far, this often signals that a market may be about to initiate a new trend. The current weekly Bollinger Band width (BBW) in the Nikkei is also at an extreme low, which supports the low ADX. Unfortunately, these indicators fail to provide a directional forecast. |

|
| Figure 1: Weekly Nikkei. The current low volatility in the Nikkei can be demonstrated through the converging trading range on the bar charts, but the technical indicators demonstrate a more objective assessment. |
| Graphic provided by: StockCharts.com. |
| |
| Utilizing the highly effective and disciplined breakout or channel rule in conjunction with the aforementioned volatility gauges may give traders the chance to capture the sharp trend that is anticipated. Richard Donchian developed the four-week rule, which is a trend-following technique that enables a trade to be executed when the price exceeds the highs, or conversely the lows, of the preceding four weeks. Following a move upward in both the weekly ADX and BBW, a position could be initiated when the Nikkei records a new four-week extreme. This would allow the trader to remain on the correct side of a potentially powerful and sharp trend. |
Chris Manuell spent 7 years as a futures sales/trader for a large investment bank and more recently as a technical analyst for an independent research company. He has a bachelor of economics and graduate diploma in applied finance & investment. Currently enrolled in the CMT program with the MTA.
| E-mail address: | chrismanuell5@yahoo.co.uk |
Click here for more information about our publications!
Comments
Date: 12/11/04Rank: 4Comment:

Request Information From Our Sponsors
- VectorVest, Inc.
- Executive Premier Workshop
- One-Day Options Course
- OptionsPro
- Retirement Income Workshop
- Sure-Fire Trading Systems (VectorVest, Inc.)
- Trading as a Business Workshop
- VectorVest 7 EOD
- VectorVest 7 RealTime/IntraDay
- VectorVest AutoTester
- VectorVest Educational Services
- VectorVest OnLine
- VectorVest Options Analyzer
- VectorVest ProGraphics v6.0
- VectorVest ProTrader 7
- VectorVest RealTime Derby Tool
- VectorVest Simulator
- VectorVest Variator
- VectorVest Watchdog
- StockCharts.com, Inc.
- Candle Patterns
- Candlestick Charting Explained
- Intermarket Technical Analysis
- John Murphy on Chart Analysis
- John Murphy's Chart Pattern Recognition
- John Murphy's Market Message
- MurphyExplainsMarketAnalysis-Intermarket Analysis
- MurphyExplainsMarketAnalysis-Visual Analysis
- StockCharts.com
- Technical Analysis of the Financial Markets
- The Visual Investor
