HOT TOPICS LIST
- MACD
- Fibonacci
- RSI
- Gann
- ADXR
- Stochastics
- Volume
- Triangles
- Futures
- Cycles
- Volatility
- ZIGZAG
- MESA
- Retracement
- Aroon
INDICATORS LIST
LIST OF TOPICS
PRINT THIS ARTICLE
by David Penn
An early November channel breakout + an early December test of resistance-turned-support = higher prices for the S&P 500 in the near term.
Position: N/A
David Penn
Technical Writer for Technical Analysis of STOCKS & COMMODITIES magazine, Working-Money.com, and Traders.com Advantage.
PRINT THIS ARTICLE
CHANNEL LINES
Testing The Channel
12/10/04 08:05:26 AMby David Penn
An early November channel breakout + an early December test of resistance-turned-support = higher prices for the S&P 500 in the near term.
Position: N/A
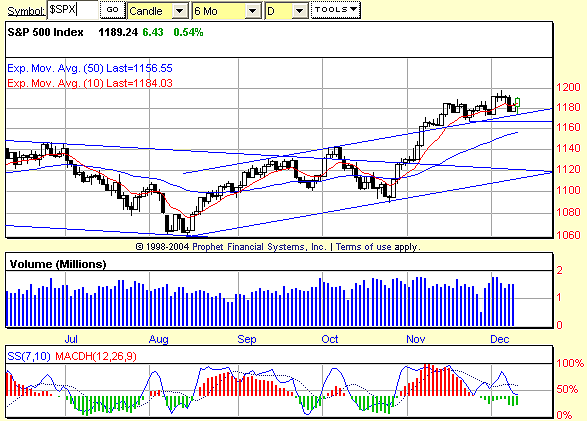
| Stocks in the Standard & Poor's 500 have been in a bull market of sorts for nearly four months. This bull market of sorts began with the August bottom in the S&P, and a major move higher--anticipated by the positive divergences surrounding the October low (see my "Divergences And The Bush Bounce," Traders.com Advantage, November 9, 2004)--in the autumn appeared to confirm the bullishness. |
| An interesting acceleration of this advance came in early November, as the S&P 500 broke out above a trend channel that extends back to the August lows. What was required for this breakout to hold was a test of the upper boundary of the price channel. A successful test would be an excellent example of resistance-turned-support. |

|
| Figure 1: The trend channel that contained the S&P 500's rally from the August lows may prove instrumental in supporting an accelerated move higher. |
| Graphic provided by: Prophet Financial, Inc. |
| |
| So far, so good. Since breaking out above the trend channel on November 4 (the day after the US Presidential election), the S&P 500 has repeatedly tested the topside of the upper boundary of that channel. Specific test dates were November 10, November 19, and December 7. Yesterday's action (December 9), which saw a sharp selloff turn into a sizable short-covering rally late in the morning (see my pair of articles for Traders.com Advantage, "An Intraday Diamond In The S&P 500" and "An Intraday Flag In The E-Mini S&P") was effectively another test of how much support that upper trend channel boundary could provide. |
| The trend channel is approximately 60 points wide. If we treat the trend channel like any other technical chart pattern (such as a triangle, head-and-shoulders bottom, or flag) and treat the early November breakout as we would any other breakout from a chart pattern, then it would be reasonable to project that the current advance in the S&P 500 might make a minimum upside move to 1220. This is derived by adding the width of the trend channel to the value at the breakout point in early November (approximately 1160). Any move toward a new high (for instance, a close above 1191.25 or so) would make a run on 1220 or higher all the more likely. |
| If, indeed, the primary impetus for the rally on December 9 was short-covering, then there is an excellent chance that the upper boundary of the August-December trend channel will hold. Such support would likely draw in true buyers, as opposed to those merely covering short positions. And it is that cohort of true buyers who would be instrumental in pushing the S&P 500 up above the 1200 level. |
Technical Writer for Technical Analysis of STOCKS & COMMODITIES magazine, Working-Money.com, and Traders.com Advantage.
| Title: | Technical Writer |
| Company: | Technical Analysis, Inc. |
| Address: | 4757 California Avenue SW |
| Seattle, WA 98116 | |
| Phone # for sales: | 206 938 0570 |
| Fax: | 206 938 1307 |
| Website: | www.Traders.com |
| E-mail address: | DPenn@traders.com |
Traders' Resource Links | |
| Charting the Stock Market: The Wyckoff Method -- Books | |
| Working-Money.com -- Online Trading Services | |
| Traders.com Advantage -- Online Trading Services | |
| Technical Analysis of Stocks & Commodities -- Publications and Newsletters | |
| Working Money, at Working-Money.com -- Publications and Newsletters | |
| Traders.com Advantage -- Publications and Newsletters | |
| Professional Traders Starter Kit -- Software | |
Click here for more information about our publications!
Comments
Date: 12/11/04Rank: 5Comment:

Request Information From Our Sponsors
- VectorVest, Inc.
- Executive Premier Workshop
- One-Day Options Course
- OptionsPro
- Retirement Income Workshop
- Sure-Fire Trading Systems (VectorVest, Inc.)
- Trading as a Business Workshop
- VectorVest 7 EOD
- VectorVest 7 RealTime/IntraDay
- VectorVest AutoTester
- VectorVest Educational Services
- VectorVest OnLine
- VectorVest Options Analyzer
- VectorVest ProGraphics v6.0
- VectorVest ProTrader 7
- VectorVest RealTime Derby Tool
- VectorVest Simulator
- VectorVest Variator
- VectorVest Watchdog
- StockCharts.com, Inc.
- Candle Patterns
- Candlestick Charting Explained
- Intermarket Technical Analysis
- John Murphy on Chart Analysis
- John Murphy's Chart Pattern Recognition
- John Murphy's Market Message
- MurphyExplainsMarketAnalysis-Intermarket Analysis
- MurphyExplainsMarketAnalysis-Visual Analysis
- StockCharts.com
- Technical Analysis of the Financial Markets
- The Visual Investor
