HOT TOPICS LIST
- MACD
- Fibonacci
- RSI
- Gann
- ADXR
- Stochastics
- Volume
- Triangles
- Futures
- Cycles
- Volatility
- ZIGZAG
- MESA
- Retracement
- Aroon
INDICATORS LIST
LIST OF TOPICS
PRINT THIS ARTICLE
by David Penn
The S&P 500 waved its freak flag high as an early morning bounce caught bears by surprise. Frantic short-covering ensued.
Position: N/A
David Penn
Technical Writer for Technical Analysis of STOCKS & COMMODITIES magazine, Working-Money.com, and Traders.com Advantage.
PRINT THIS ARTICLE
FLAGS AND PENNANTS
An Intraday Flag In The Emini S&P
12/10/04 01:51:35 PMby David Penn
The S&P 500 waved its freak flag high as an early morning bounce caught bears by surprise. Frantic short-covering ensued.
Position: N/A
| "They're hoping soon my kind will drop and die," intones legendary psychedelic guitarist Jimi Hendrix in his classic song, "If 6 Were 9." But Jimi could have been talking about those market bears long fed up with a market that, until recently, seemed completely incapable of rolling over. When the market moved downward sharply on the morning of December 9, it wasn't hard to imagine legions of bears around the country shouting, "Die, Bull Market! Die!" in anticipatory glee. With the futures hinting at an exceptionally negative open, it looked as if the bears--at least in the short term--would get their wish. |
| And for the first few hours of the morning, that appeared to be the case. Stocks opened down and continued to move down in the first hour or two of trading. But between 7:30 and 8:30 (10:30-11:30 am ET) , the market's decline slowed and then, while not reversing, turned into a consolidation with a mildly upward bias. This mildly upward bias turned into a pretty passionate upward conviction by 9:30 am (12:30 pm ET). Makes you wonder what traders on the East Coast were having for lunch. Bear burgers, perhaps? |

|
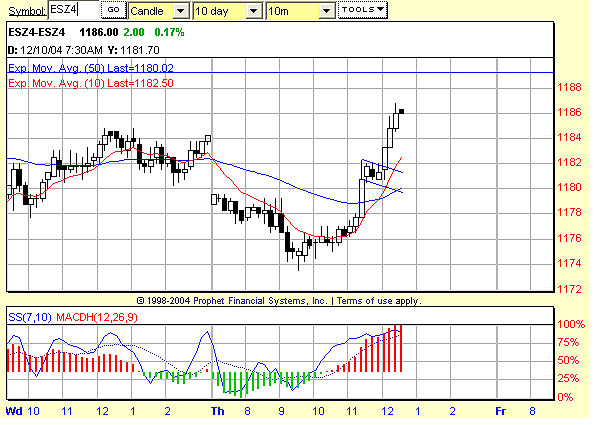
| Figure 1: The positive stochastic divergence in the early morning hours on Thursday anticipated a reversal in the emini S&P. The flag that developed shortly after prices broke out above the 50-period EMA suggests higher prices and a likely test of the 1190 area. |
| Graphic provided by: Prophet Financial, Inc. |
| |
| The bears might be forgiven for being taken by surprise with the sudden, late-morning rally in the emini S&P. While the 7,10 stochastic in my eSignal 10-minute chart did not spot a divergence, the positive divergence that anticipated the surge in the Standard & Poor's 500 was clearly evident in the Prophet.net chart shown in Figure 1. This positive divergence--consecutively lower lows in the December emini and consecutively higher lows in the 7,10 stochastic--was accompanied by a hammer candlestick near 9:30 am (12:30 pm ET), and together, should have been a strong warning that the odds for a reversal were getting better and better. That alone might explain the force of the rally that ensued. In fact, the rally on December 9 shares some similarity to the abruptness of the month-long rally from late October to late November (see my Traders.com Advantage piece, "Divergences And The Bush Bounce," November 9, 2004). |
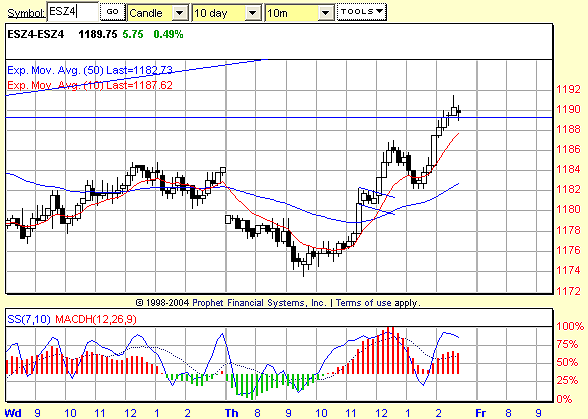
In any event, what sort of upside might this intraday flag anticipate? The basic measurement rule for flags is to take the distance from the beginning of the advance to the point where the flag begins, and to add that amount to the value at the point where prices break free from the flag. Given the move from the early morning low (1174) to the beginning of the flag (1182) is eight points, we add eight to the value at the breakout (1182). This gives a minimum upside of 1190. Figure 2: After breaking out from an intraday flag, the December emini rallied to its minimum projected upside of 1190. Note how the pullback in the early afternoon found support at precisely the level of the initial breakout, 1182. |
Technical Writer for Technical Analysis of STOCKS & COMMODITIES magazine, Working-Money.com, and Traders.com Advantage.
| Title: | Technical Writer |
| Company: | Technical Analysis, Inc. |
| Address: | 4757 California Avenue SW |
| Seattle, WA 98116 | |
| Phone # for sales: | 206 938 0570 |
| Fax: | 206 938 1307 |
| Website: | www.Traders.com |
| E-mail address: | DPenn@traders.com |
Traders' Resource Links | |
| Charting the Stock Market: The Wyckoff Method -- Books | |
| Working-Money.com -- Online Trading Services | |
| Traders.com Advantage -- Online Trading Services | |
| Technical Analysis of Stocks & Commodities -- Publications and Newsletters | |
| Working Money, at Working-Money.com -- Publications and Newsletters | |
| Traders.com Advantage -- Publications and Newsletters | |
| Professional Traders Starter Kit -- Software | |
Click here for more information about our publications!
Comments
Date: 12/11/04Rank: 3Comment:
Date: 12/19/04Rank: 5Comment: Excellent. Great clarity in the exposition of the points. The graphic is clear.

|

Request Information From Our Sponsors
- StockCharts.com, Inc.
- Candle Patterns
- Candlestick Charting Explained
- Intermarket Technical Analysis
- John Murphy on Chart Analysis
- John Murphy's Chart Pattern Recognition
- John Murphy's Market Message
- MurphyExplainsMarketAnalysis-Intermarket Analysis
- MurphyExplainsMarketAnalysis-Visual Analysis
- StockCharts.com
- Technical Analysis of the Financial Markets
- The Visual Investor
- VectorVest, Inc.
- Executive Premier Workshop
- One-Day Options Course
- OptionsPro
- Retirement Income Workshop
- Sure-Fire Trading Systems (VectorVest, Inc.)
- Trading as a Business Workshop
- VectorVest 7 EOD
- VectorVest 7 RealTime/IntraDay
- VectorVest AutoTester
- VectorVest Educational Services
- VectorVest OnLine
- VectorVest Options Analyzer
- VectorVest ProGraphics v6.0
- VectorVest ProTrader 7
- VectorVest RealTime Derby Tool
- VectorVest Simulator
- VectorVest Variator
- VectorVest Watchdog
