HOT TOPICS LIST
- MACD
- Fibonacci
- RSI
- Gann
- ADXR
- Stochastics
- Volume
- Triangles
- Futures
- Cycles
- Volatility
- ZIGZAG
- MESA
- Retracement
- Aroon
INDICATORS LIST
LIST OF TOPICS
PRINT THIS ARTICLE
by David Penn
A diamond top in the 60-minute S&P 500 chart sets the stage for a short-term correction in stocks.
Position: N/A
David Penn
Technical Writer for Technical Analysis of STOCKS & COMMODITIES magazine, Working-Money.com, and Traders.com Advantage.
PRINT THIS ARTICLE
THE DIAMOND
An Intraday Diamond In The S&P 500
12/09/04 02:04:05 PMby David Penn
A diamond top in the 60-minute S&P 500 chart sets the stage for a short-term correction in stocks.
Position: N/A
| If you're are like most people watching television during the winter holiday season, then you've probably been inundated with commercials by diamond retailers. Perhaps you even have a favorite. I'll admit to finding these advertisements particularly cloying--especially those that feature wives reduced to trembling bundles of passionate gratitude as soon as their husbands pop open that little box with a tiny hunk of crystallized carbon tucked inside. |
| I don't have anything against diamonds. Diamonds are a girl's best friend. Diamonds are forever. I'm down with diamonds--especially when they appear at the top of trends, as the diamond in Figure 1 seems to have done. |

|
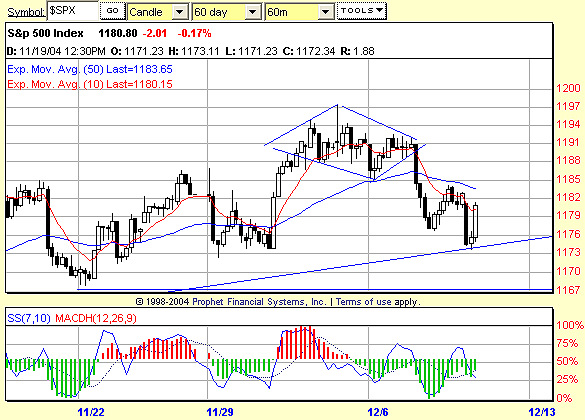
| Figure 1: The breakdown from this diamond top in the hourly S&P 500 reached its minimum downside target within three hours after it penetrated the diamond to the downside. |
| Graphic provided by: Prophet Financial, Inc. |
| |
| Diamond consolidations can appear as both continuation as well as reversal patterns. And while there are a number of clues that sometimes can be helpful in telling which diamonds are more likely to be continuations and which diamonds are likely to be reversals, many technicians prefer to wait for a breakout or breakdown before jumping on board and trading the move. In the case of this diamond consolidation, there were a number of clues that the break would be to the downside. The shooting star early in the morning of December 3 was one clue that the market in general might be ready to pull back. And the negative divergence between prices early in the month and the 7,10 stochastic was similarly suggestive of lower prices going forward. |
| Nevertheless, the breakdown when it occurred was definitive, sending the Standard & Poor's 500 crashing through its 10- and 50-period exponential moving averages (EMA). Given a pattern size of approximately 12 points (measuring the diamond from its highest point to its lowest point), and a breakdown level of 1191, traders could expect the S&P 500 to make a minimum downside move to the 1179 area. The S&P 500 did just that, and by the end of trading on December 7 was trading near 1177. After a bounce into resistance in the form of the 50-period EMA, the S&P 500 retested the post-breakdown lows shortly thereafter, forming what appears to be a morning star- like reversal pattern during the first few hours of trading on December 9. If the 7,10 stochastic fails to make a lower low, then traders should be on the lookout for a positive stochastic divergence that could send the S&P 500 back up to a test of the breakout level at 1191. |
| That said, technician Thomas Bulkowski has observed that the tops created by diamond consolidations tend to be particularly long-lasting. Specifically, Bulkowski writes, "The formation creates a location for support or resistance (SAR). Diamond tops usually show SAR near the top of the formation, whereas diamond bottoms show SAR near the formation bottom. SAR duration can last up to a year or more." That duration is "basis daily charts." But if what Bulkowski suggests is true, then those traders looking for a significant top in the S&P 500 may have found no better friend than this diamond. |
Technical Writer for Technical Analysis of STOCKS & COMMODITIES magazine, Working-Money.com, and Traders.com Advantage.
| Title: | Technical Writer |
| Company: | Technical Analysis, Inc. |
| Address: | 4757 California Avenue SW |
| Seattle, WA 98116 | |
| Phone # for sales: | 206 938 0570 |
| Fax: | 206 938 1307 |
| Website: | www.Traders.com |
| E-mail address: | DPenn@traders.com |
Traders' Resource Links | |
| Charting the Stock Market: The Wyckoff Method -- Books | |
| Working-Money.com -- Online Trading Services | |
| Traders.com Advantage -- Online Trading Services | |
| Technical Analysis of Stocks & Commodities -- Publications and Newsletters | |
| Working Money, at Working-Money.com -- Publications and Newsletters | |
| Traders.com Advantage -- Publications and Newsletters | |
| Professional Traders Starter Kit -- Software | |
Click here for more information about our publications!
Comments
Date: 12/09/04Rank: 4Comment:

Request Information From Our Sponsors
- VectorVest, Inc.
- Executive Premier Workshop
- One-Day Options Course
- OptionsPro
- Retirement Income Workshop
- Sure-Fire Trading Systems (VectorVest, Inc.)
- Trading as a Business Workshop
- VectorVest 7 EOD
- VectorVest 7 RealTime/IntraDay
- VectorVest AutoTester
- VectorVest Educational Services
- VectorVest OnLine
- VectorVest Options Analyzer
- VectorVest ProGraphics v6.0
- VectorVest ProTrader 7
- VectorVest RealTime Derby Tool
- VectorVest Simulator
- VectorVest Variator
- VectorVest Watchdog
- StockCharts.com, Inc.
- Candle Patterns
- Candlestick Charting Explained
- Intermarket Technical Analysis
- John Murphy on Chart Analysis
- John Murphy's Chart Pattern Recognition
- John Murphy's Market Message
- MurphyExplainsMarketAnalysis-Intermarket Analysis
- MurphyExplainsMarketAnalysis-Visual Analysis
- StockCharts.com
- Technical Analysis of the Financial Markets
- The Visual Investor
