HOT TOPICS LIST
- MACD
- Fibonacci
- RSI
- Gann
- ADXR
- Stochastics
- Volume
- Triangles
- Futures
- Cycles
- Volatility
- ZIGZAG
- MESA
- Retracement
- Aroon
INDICATORS LIST
LIST OF TOPICS
PRINT THIS ARTICLE
by Kevin Hopson
Until the market becomes overly bullish on this company, the stock price has higher to go.
Position: Accumulate
Kevin Hopson
Kevin has been a technical analyst for roughly 10 years now. Previously, Kevin owned his own business and acted as a registered investment advisor, specializing in energy. He was also a freelance oil analyst for Orient Trading Co., a commodity futures trading firm in Japan. Kevin is currently a freelance writer.
PRINT THIS ARTICLE
CHANNEL LINES
Grant Prideco's Trading Range Formation
12/09/04 09:27:51 AMby Kevin Hopson
Until the market becomes overly bullish on this company, the stock price has higher to go.
Position: Accumulate
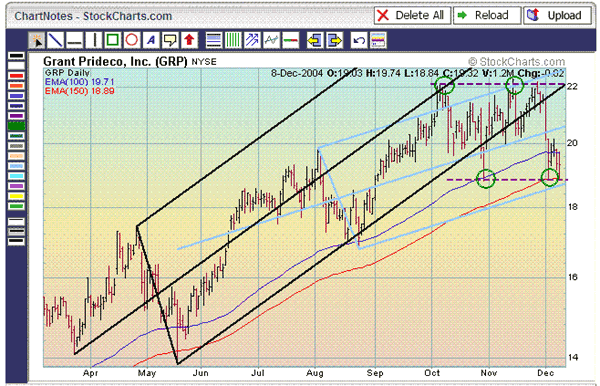
| Like a number of other oil and gas companies, Grant Prideco (GRP) has seen its stock price decline in recent days. However, the bigger picture is still bullish, as the stock appears to be stuck in a potentially bullish trading range. For example, note how prices found resistance around the $22.00 level in early October after rallying in August and September. This price level has acted as solid resistance for the stock the last two months, effectively forming the top of the trading range. |
| On the other hand, Grant Prideco has been finding support around the $18.80 level, effectively forming the bottom of the trading range. Support at $18.80 is significant for various reasons. For one thing, this is the site of the 61.8% retracement level from the August to November rally. Because the 61.8% retracement tends to act as the ultimate reversal point during corrections, it is important for it to hold. Also coming into play here is the stock's 150-day moving average ($18.89), as well as the bottom parallel line of the blue pitchfork. |

|
| Figure 1: Grant Prideco. Like a number of other oil and gas companies, Grant Prideco has seen its stock price decline in recent days. However, the bigger picture is still bullish, as the stock appears to be stuck in a potentially bullish trading range. |
| Graphic provided by: StockCharts.com. |
| |
| Because trading ranges tend to be continuation patterns and the long-term trend is up, Grant Prideco should see an eventual break to the upside. If so, the trading range formation indicates a potential upside target of between $29.00 and $32.00. This assumes that the stock will break out on the next test of the top channel line. I calculated this price target by taking the number of times that prices will test the top channel line in alternate sequence before breaking out (3), multiplying this number by the width of the trading range ($22.20-$18.80=$3.40), and then adding this figure ($3.40*3=$10.20) to the bottom ($18.80+$10.20=$29.00) and top ($22.20+$10.20=$32.40) channel lines. |
| If the stock can breach resistance just above the $22.00 level, the site of the top channel line and the bottom black parallel line, a breakout will be confirmed. In the meantime, market sentiment toward the company continues to be pessimistic, meaning there is a lot of potential buying pressure to push the stock higher. For example, short interest was 5.34 million shares as of November 8, which equates to a short interest ratio of roughly 5.0 times. In addition, nearly half (47%) of the analysts covering the company currently have a "hold" or "sell" rating on the stock. |
| If that is not enough, the stock's put/call open interest ratio has been moving higher recently. Though this ratio only stands at 0.27, it is hovering near a one-year peak and is higher than 96% of the readings over the past 12 months (source: Schaeffers Research, http://www.schaeffersresearch.com). Because market sentiment continues to be negative despite the stock's recent runup, there is likely more upside potential for the company. As a result, I would look to accumulate shares of Grant Prideco in anticipation of higher prices in the long term. Even though the stock has not officially broken out of its trading range and could move lower, the risk/reward is favorable at current levels. |
Kevin has been a technical analyst for roughly 10 years now. Previously, Kevin owned his own business and acted as a registered investment advisor, specializing in energy. He was also a freelance oil analyst for Orient Trading Co., a commodity futures trading firm in Japan. Kevin is currently a freelance writer.
| Glen Allen, VA | |
| E-mail address: | hopson_1@yahoo.com |
Click here for more information about our publications!
Comments
Date: 12/09/04Rank: 2Comment:

|

Request Information From Our Sponsors
- StockCharts.com, Inc.
- Candle Patterns
- Candlestick Charting Explained
- Intermarket Technical Analysis
- John Murphy on Chart Analysis
- John Murphy's Chart Pattern Recognition
- John Murphy's Market Message
- MurphyExplainsMarketAnalysis-Intermarket Analysis
- MurphyExplainsMarketAnalysis-Visual Analysis
- StockCharts.com
- Technical Analysis of the Financial Markets
- The Visual Investor
- VectorVest, Inc.
- Executive Premier Workshop
- One-Day Options Course
- OptionsPro
- Retirement Income Workshop
- Sure-Fire Trading Systems (VectorVest, Inc.)
- Trading as a Business Workshop
- VectorVest 7 EOD
- VectorVest 7 RealTime/IntraDay
- VectorVest AutoTester
- VectorVest Educational Services
- VectorVest OnLine
- VectorVest Options Analyzer
- VectorVest ProGraphics v6.0
- VectorVest ProTrader 7
- VectorVest RealTime Derby Tool
- VectorVest Simulator
- VectorVest Variator
- VectorVest Watchdog
