HOT TOPICS LIST
- MACD
- Fibonacci
- RSI
- Gann
- ADXR
- Stochastics
- Volume
- Triangles
- Futures
- Cycles
- Volatility
- ZIGZAG
- MESA
- Retracement
- Aroon
INDICATORS LIST
LIST OF TOPICS
PRINT THIS ARTICLE
by Arthur Hill
The Nikkei Composite has been consolidating over the last 10 months, and the next break should produce a significant move.
Position: Hold
Arthur Hill
Arthur Hill is currently editor of TDTrader.com, a website specializing in trading strategies, sector/industry specific breadth stats and overall technical analysis. He passed the Society of Technical Analysts (STA London) diploma exam with distinction is a Certified Financial Technician (CFTe). Prior to TD Trader, he was the Chief Technical Analyst for Stockcharts.com and the main contributor to the ChartSchool.
PRINT THIS ARTICLE
SYMMETRICAL TRIANGLE
Noose Tightens On Nikkei
12/09/04 07:58:26 AMby Arthur Hill
The Nikkei Composite has been consolidating over the last 10 months, and the next break should produce a significant move.
Position: Hold
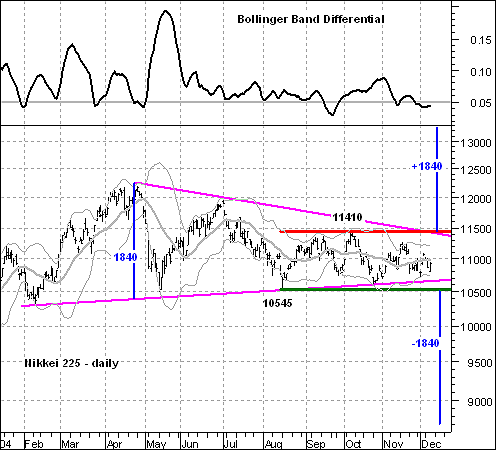
| For the Nikkei, the price pattern over the last 10 months shows a symmetrical triangle. These are neutral patterns that show a tightening range as time progresses. The lows are getting higher and the highs are getting lower, as neither bulls nor bears can seize control. Since August, the consolidation has flattened, with key support at 10545 and key resistance at 11410. A break up or down would signal an exit from triangle and the start of the next move. |
| Bollinger Bands confirm that a breakout could be near. Bollinger Bands are based on volatility, and the bands narrow as volatility decreases. The assumption is that periods of low volatility are followed by periods of higher volatility. The top chart shows the Bollinger Band differential as a percentage of the 20-day simple moving average (SMA), which is the middle band. Note that it has dipped below 5%, and this low reading shows relatively low volatility. |

|
| Figure 1: Nikkei Composite. The Nikkei has been consolidating over the last 10 months, and the next break should produce a significant move. |
| Graphic provided by: MetaStock. |
| Graphic provided by: Reuters Data. |
| |
| For a target, we can measure the length of the pattern (about 1840) and either add or subtract it from the breakout point. This points to a rather sizable move once the breakout occurs. Triangles are like springs: The longer they extend, the tighter they become. The breakout releases the spring and often leads to a sharp break. Get ready.... |
Arthur Hill is currently editor of TDTrader.com, a website specializing in trading strategies, sector/industry specific breadth stats and overall technical analysis. He passed the Society of Technical Analysts (STA London) diploma exam with distinction is a Certified Financial Technician (CFTe). Prior to TD Trader, he was the Chief Technical Analyst for Stockcharts.com and the main contributor to the ChartSchool.
| Title: | Editor |
| Company: | TDTrader.com |
| Address: | Willem Geetsstraat 17 |
| Mechelen, B2800 | |
| Phone # for sales: | 3215345465 |
| Website: | www.tdtrader.com |
| E-mail address: | arthurh@tdtrader.com |
Traders' Resource Links | |
| TDTrader.com has not added any product or service information to TRADERS' RESOURCE. | |
Click here for more information about our publications!
Comments
Date: 12/09/04Rank: 5Comment:

Request Information From Our Sponsors
- VectorVest, Inc.
- Executive Premier Workshop
- One-Day Options Course
- OptionsPro
- Retirement Income Workshop
- Sure-Fire Trading Systems (VectorVest, Inc.)
- Trading as a Business Workshop
- VectorVest 7 EOD
- VectorVest 7 RealTime/IntraDay
- VectorVest AutoTester
- VectorVest Educational Services
- VectorVest OnLine
- VectorVest Options Analyzer
- VectorVest ProGraphics v6.0
- VectorVest ProTrader 7
- VectorVest RealTime Derby Tool
- VectorVest Simulator
- VectorVest Variator
- VectorVest Watchdog
- StockCharts.com, Inc.
- Candle Patterns
- Candlestick Charting Explained
- Intermarket Technical Analysis
- John Murphy on Chart Analysis
- John Murphy's Chart Pattern Recognition
- John Murphy's Market Message
- MurphyExplainsMarketAnalysis-Intermarket Analysis
- MurphyExplainsMarketAnalysis-Visual Analysis
- StockCharts.com
- Technical Analysis of the Financial Markets
- The Visual Investor
