HOT TOPICS LIST
- MACD
- Fibonacci
- RSI
- Gann
- ADXR
- Stochastics
- Volume
- Triangles
- Futures
- Cycles
- Volatility
- ZIGZAG
- MESA
- Retracement
- Aroon
INDICATORS LIST
LIST OF TOPICS
PRINT THIS ARTICLE
by Koos van der Merwe
Transmeta is a company that should have the world at its feet. The company, however, simply cannot get off the ground. The charts tell all.
Position: N/A
Koos van der Merwe
Has been a technical analyst since 1969, and has worked as a futures and options trader with First Financial Futures in Johannesburg, South Africa.
PRINT THIS ARTICLE
CUP WITH HANDLE
Transmeta
12/08/04 03:56:39 PMby Koos van der Merwe
Transmeta is a company that should have the world at its feet. The company, however, simply cannot get off the ground. The charts tell all.
Position: N/A
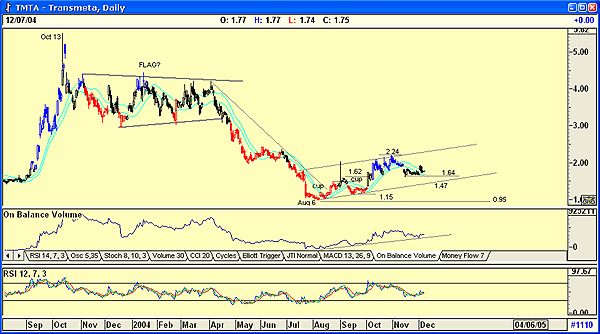
| It's curious. Transmeta is a company that should have the world at its feet, seeing that they manufacture the Caruso chip, used by laptops in competition to Intel's Pentium chips. For one reason or another, however, the company simply cannot get off the ground. The earliest I have on a chart for Transmeta is $50.87 on November 10, 2000, the height of the bubble. From that auspicious date, the share price has fallen steadily in spite of much optimism that as a competitor to Intel, it had to become a success story. Unfortunately, this was wishful thinking, and the share price fell to a low of $0.97 by October 25, 2002. The price recovered, but the highest the share price reached was $5.51 on October 13, 2003. The daily share price shown in Figure 1 shows that date and what looked like a flag formation that developed, but the breakout was downward, rather than the anticipated breakout upward. |
| We could argue that the flag was formed on the downtrend, from the high of October 13, and that the down move out of the flag was correct, a trend confirmed by the downward trending relative strength index (RSI). However, we do live in hope, and the optimists would have traded what they thought they saw, not what the chart was telling them. On August 6, 2004, the share price closed at $1.00. It then formed a cup and handle formation, broke out, and then formed a second cup and handle formation. The target calculated for the second cup and handle was $2.09 (1.62 - 1.15 = 0.47 + 1.62 = 2.09), and the price actually reached a high of $2.24 before falling back. |

|
| Figure 1: Transmeta monthly chart. The stock should have been a blockbuster ... but no. |
| Graphic provided by: AdvancedGET. |
| |
| The chart now shows that the price has formed what could turn out to be a head and shoulders pattern that will be triggered by a break below $1.64. This gives a target of $1.04 ($2.24 - 1.64 = 0.60. 1.64 - 0.64 = 1.04), a price close enough to the support of 0.95. The RSI is confirming that the trend is down, and that the likelihood of the price forming a double bottom at $0.95 is very real. It would, however, have to break below the support line at $1.47 or higher depending on the time period, and this could turn out to be a strong support level. |
| Bulls, on the other hand, would look to that support level as an accumulation level. This support line has been tested three times and held. The share price has also fallen to the pivot point level of $1.62 / $1.64 and held. The on-balance volume support line is holding, and finally, the share price has risen above the upper JM internal band line, triggering a buy signal. Red Hat with Linux took on Microsoft and died. Transmeta has taken on another giant, Intel, and has survived, but only just. Financial figures are not encouraging, and charts appear to be at a turning point either way, but first, the signals must be given. |
Has been a technical analyst since 1969, and has worked as a futures and options trader with First Financial Futures in Johannesburg, South Africa.
| Address: | 3256 West 24th Ave |
| Vancouver, BC | |
| Phone # for sales: | 6042634214 |
| E-mail address: | petroosp@gmail.com |
Click here for more information about our publications!
Comments
Date: 12/08/04Rank: 5Comment:
Date: 12/09/04Rank: 1Comment:

Request Information From Our Sponsors
- StockCharts.com, Inc.
- Candle Patterns
- Candlestick Charting Explained
- Intermarket Technical Analysis
- John Murphy on Chart Analysis
- John Murphy's Chart Pattern Recognition
- John Murphy's Market Message
- MurphyExplainsMarketAnalysis-Intermarket Analysis
- MurphyExplainsMarketAnalysis-Visual Analysis
- StockCharts.com
- Technical Analysis of the Financial Markets
- The Visual Investor
- VectorVest, Inc.
- Executive Premier Workshop
- One-Day Options Course
- OptionsPro
- Retirement Income Workshop
- Sure-Fire Trading Systems (VectorVest, Inc.)
- Trading as a Business Workshop
- VectorVest 7 EOD
- VectorVest 7 RealTime/IntraDay
- VectorVest AutoTester
- VectorVest Educational Services
- VectorVest OnLine
- VectorVest Options Analyzer
- VectorVest ProGraphics v6.0
- VectorVest ProTrader 7
- VectorVest RealTime Derby Tool
- VectorVest Simulator
- VectorVest Variator
- VectorVest Watchdog
