HOT TOPICS LIST
- MACD
- Fibonacci
- RSI
- Gann
- ADXR
- Stochastics
- Volume
- Triangles
- Futures
- Cycles
- Volatility
- ZIGZAG
- MESA
- Retracement
- Aroon
INDICATORS LIST
LIST OF TOPICS
PRINT THIS ARTICLE
by Koos van der Merwe
The company made its name with the invention of the Big Bertha driver, and its share price soared. Then came the copy cats, and the share price fell. What now?
Position: Accumulate
Koos van der Merwe
Has been a technical analyst since 1969, and has worked as a futures and options trader with First Financial Futures in Johannesburg, South Africa.
PRINT THIS ARTICLE
SYMMETRICAL TRIANGLE
Callaway Golf Company
12/07/04 04:04:01 PMby Koos van der Merwe
The company made its name with the invention of the Big Bertha driver, and its share price soared. Then came the copy cats, and the share price fell. What now?
Position: Accumulate
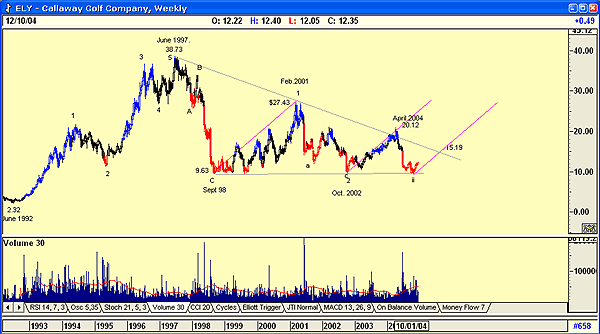
| Golfers know the name Callaway. The Callaway Golf Co. invented the Big Bertha, an all-metal golf driver that adds extra distance to a golfer's drive. The invention changed the way golf is played, and many courses had to increase the length of their holes in order to retain their slope rating (that is, their degree of difficulty). The company's share price, as shown in the weekly chart (Figure 1), soared from a low of $2.32 in June 1992 to a high of $38.73 in June 1997. The price started falling well before the market bubble of 2000 burst, falling to a low of $9.63 by September 1998. This may have been because of market saturation of metal drivers; other manufacturers realized a good thing when they saw it, and improved on the Big Bertha. |
| Callaway redesigned its driver, and came out with other clubs based on the same winning strategy. The share price rose to $27.43 by February 2001, a period when all other shares were falling. Then it succumbed to market pressure, or the competition came out with another product, and the share price fell to test the $9.63 low. It recovered to $20.12, and has now fallen to retest what has become a strong support level at $9.63. |

|
| Figure 1: Calloway Golf. The Elliott wave count shown suggests that the share could rise in a wave iii of a wave 3, but the flat-bottomed triangle that has formed suggests weakness |
| Graphic provided by: AdvancedGET. |
| |
| The Elliott wave count shown (Figure 1) does suggest that the share could now rise in a wave iii of a wave 3, but the flat-bottomed triangle that has formed suggests weakness, with a break below $9.63 should it occur, suggesting disaster. On the optimistic side, the relative strength index (RSI) is suggesting strength, and to determine a possible resistance area on the downward sloping resistance line, I have drawn a parallel line to the rise from September 1998 to February 2001. This suggests a price of $15.19 as a possible target. |
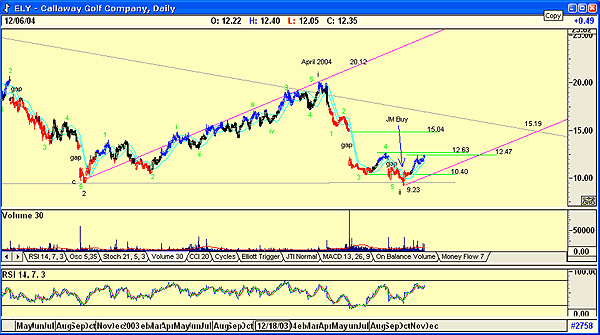
When you look at the daily chart (Figure 2), the first thing that scares you are the four downside gaps, all of them on heavy volume. They tell us that investors are quick to sell the share on any bad news, probably with accompanying shorts. The rise in the price after the fall to cover the gap could be short-covering with profit. Figure 2: Daily chart, Calloway. When you look at the daily chart, the first thing that scares you are the four downside gaps, all of them on heavy volume. However, the double bottom, with a lower bottom at $9.23, and a move above the previous low of $10.40 is very encouraging. The move above the upper JM band (blue band) at the arrow showing the JM buy is also encouraging, as is the rising RSI. A cup and handle formation could be forming, and a break above the handle's resistance of $12.47 will confirm this, giving a target of $15.71. (12.47 - 9.23 = 3.24 + 12.47 = 15.71). The target we suggested on the weekly chart was $15.19. |
| To recap: A weekly JM internal band is a 15-period simple moving average offset by 2% and -2%. A buy signal is a break above the upper band, and a short signal is a break below the lower band. Finally, a share price rises to fill a gap. The third gap has been filled, and the second gap has a top end of $15.04. I wouldn't be surprised if the share price fell to retest $10.40 and then rise. This would see the formation of the right shoulder of a head and shoulders pattern. Either way, whatever the immediate short-term trend, you would only purchase the share if and when it breaks above the $12.47 level. This is another stock to add to your watchlist. |
Has been a technical analyst since 1969, and has worked as a futures and options trader with First Financial Futures in Johannesburg, South Africa.
| Address: | 3256 West 24th Ave |
| Vancouver, BC | |
| Phone # for sales: | 6042634214 |
| E-mail address: | petroosp@gmail.com |
Click here for more information about our publications!
Comments
Date: 12/07/04Rank: 3Comment:

Request Information From Our Sponsors
- StockCharts.com, Inc.
- Candle Patterns
- Candlestick Charting Explained
- Intermarket Technical Analysis
- John Murphy on Chart Analysis
- John Murphy's Chart Pattern Recognition
- John Murphy's Market Message
- MurphyExplainsMarketAnalysis-Intermarket Analysis
- MurphyExplainsMarketAnalysis-Visual Analysis
- StockCharts.com
- Technical Analysis of the Financial Markets
- The Visual Investor
- VectorVest, Inc.
- Executive Premier Workshop
- One-Day Options Course
- OptionsPro
- Retirement Income Workshop
- Sure-Fire Trading Systems (VectorVest, Inc.)
- Trading as a Business Workshop
- VectorVest 7 EOD
- VectorVest 7 RealTime/IntraDay
- VectorVest AutoTester
- VectorVest Educational Services
- VectorVest OnLine
- VectorVest Options Analyzer
- VectorVest ProGraphics v6.0
- VectorVest ProTrader 7
- VectorVest RealTime Derby Tool
- VectorVest Simulator
- VectorVest Variator
- VectorVest Watchdog
