

HOT TOPICS LIST
- MACD
- Fibonacci
- RSI
- Gann
- ADXR
- Stochastics
- Volume
- Triangles
- Futures
- Cycles
- Volatility
- ZIGZAG
- MESA
- Retracement
- Aroon
INDICATORS LIST
LIST OF TOPICS
PRINT THIS ARTICLE
by Kevin Hopson
Though the recent correction in oil service stocks may not be over, we have probably not seen the ultimate top in prices.
Position: Hold
Kevin Hopson
Kevin has been a technical analyst for roughly 10 years now. Previously, Kevin owned his own business and acted as a registered investment advisor, specializing in energy. He was also a freelance oil analyst for Orient Trading Co., a commodity futures trading firm in Japan. Kevin is currently a freelance writer.
PRINT THIS ARTICLE
TECHNICAL ANALYSIS
Why Oil Service Stocks Are Still The Place To Be
12/07/04 02:42:32 PMby Kevin Hopson
Though the recent correction in oil service stocks may not be over, we have probably not seen the ultimate top in prices.
Position: Hold
Despite the recent selloff in oil and gas prices, the Oil Services Index (OSX) has only seen minimal technical damage. For example, the index recently broke short-term support at the 118 level -- the site of the blue median line and the 38.2% retracement from the August to November rally -- but did hold above the red warning line. When prices breach the bottom parallel line of a pitchfork, which occurred last month with the black pitchfork, you want to give prices the benefit of the doubt by drawing a sliding parallel line from the low. As you can see, the index bounced off this warning line last week, keeping the current uptrend intact. This uptrend line, along with the blue median line, should provide short-term support in the 117-118 range.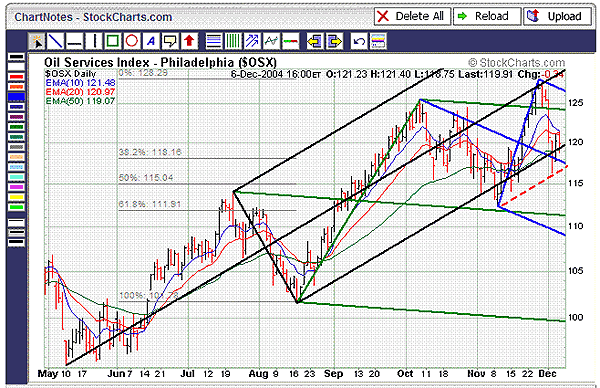 Figure 1: OSX Daily. When prices breach the bottom parallel line of a pitchfork, you want to give prices the benefit of the doubt by drawing a sliding parallel line from the low. |
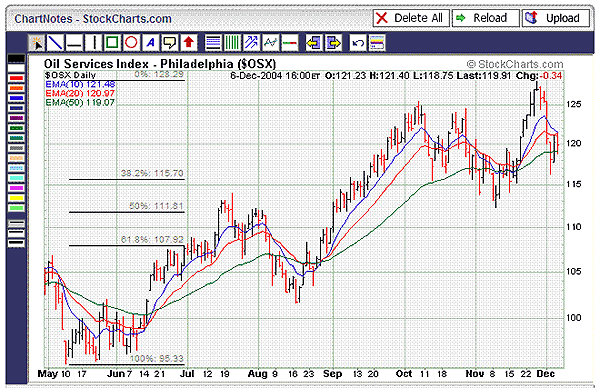
| Even if this price range is taken out, there are two other areas of support to watch. The first is the 115.00 to 115.70 range. This is the site of the 50% retracement from the August to November rally, the 38.2% retracement from the May to November rally and significant put option open interest (115 strike price). Just to elaborate, put option open interest in the December 2004 and January 2005 $115 contracts exceeds call option open interest by nearly a 5-to-1 margin. This means there is more incentive to keep prices above the 115 level in the near term because sellers of these puts would benefit from out-of-the-money contracts on expiration day. |
|
| Figure 2: OSX. There are two areas to observe. The first is the 115.00 to 115.70 range, the site of the 50% retracement from the August to November rally, the 38.2% retracement from the May to November rally. |
| Graphic provided by: StockCharts.com. |
| |
| Another area of support to watch is the 111-112 range. This is the site of the 61.8% retracement from the August to November rally, the 50% retracement from the May to November rally, and the green median line. This is where I would look for ultimate support should the index continue to pull back. Though violent corrections -- like the one we saw last week -- can be scary, they sometimes provide great buying opportunities. Because market sentiment toward oil service stocks continues to be negative, I would view the recent pullback as a bull correction and not an indication of an ultimate top. |
| If you look at the six-month chart of the put/call option open interest ratio for the OSX (Figure 3), note that put contracts outnumber call contracts by nearly a 2-to-1 margin. More specifically, this ratio currently sits at 1.79x, which is higher than 87% of the readings over the last year. In addition, only 57.1% of the analysts covering these companies (index members) have a buy rating on them, which is down from 58.3% in October. Further, several of these companies -- despite falling short interest ratios -- still have sizable short positions, which are listed below. Baker Hughes Inc. (BHI) - 4.25x Weatherford Int'l (WFT) - 4.25x Tidewater Inc. (TDW) - 3.89x Transocean Inc. (RIG) - 3.58x Rowan Cos. (RDC) - 3.53x Smith Int'l (SII) - 3.42x Global Industries (GLBL) - 3.04x 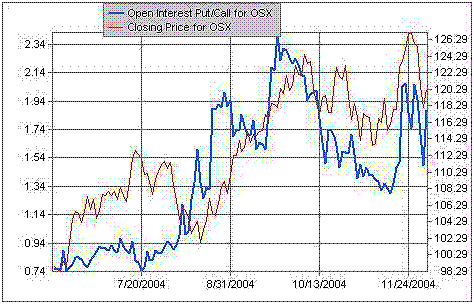 Figure 3: Open Interest Ratio, OSX. Note that put contracts outnumber call contracts by nearly a 2-to-1 margin. |
| Because market sentiment is considered a contrarian indicator and tops are often accompanied by extreme bullishness, I believe the long-term uptrend for oil service stocks remains intact. As a result, I would continue to hold shares of these stocks and look to accumulate at lower support levels. |
Kevin has been a technical analyst for roughly 10 years now. Previously, Kevin owned his own business and acted as a registered investment advisor, specializing in energy. He was also a freelance oil analyst for Orient Trading Co., a commodity futures trading firm in Japan. Kevin is currently a freelance writer.
| Glen Allen, VA | |
| E-mail address: | hopson_1@yahoo.com |
Click here for more information about our publications!
Comments
Date:�12/07/04Rank:�3Comment:�
Date:�12/07/04Rank:�5Comment:�
Date:�12/10/04Rank:�4Comment:�

Request Information From Our Sponsors
- StockCharts.com, Inc.
- Candle Patterns
- Candlestick Charting Explained
- Intermarket Technical Analysis
- John Murphy on Chart Analysis
- John Murphy's Chart Pattern Recognition
- John Murphy's Market Message
- MurphyExplainsMarketAnalysis-Intermarket Analysis
- MurphyExplainsMarketAnalysis-Visual Analysis
- StockCharts.com
- Technical Analysis of the Financial Markets
- The Visual Investor
- VectorVest, Inc.
- Executive Premier Workshop
- One-Day Options Course
- OptionsPro
- Retirement Income Workshop
- Sure-Fire Trading Systems (VectorVest, Inc.)
- Trading as a Business Workshop
- VectorVest 7 EOD
- VectorVest 7 RealTime/IntraDay
- VectorVest AutoTester
- VectorVest Educational Services
- VectorVest OnLine
- VectorVest Options Analyzer
- VectorVest ProGraphics v6.0
- VectorVest ProTrader 7
- VectorVest RealTime Derby Tool
- VectorVest Simulator
- VectorVest Variator
- VectorVest Watchdog