HOT TOPICS LIST
- MACD
- Fibonacci
- RSI
- Gann
- ADXR
- Stochastics
- Volume
- Triangles
- Futures
- Cycles
- Volatility
- ZIGZAG
- MESA
- Retracement
- Aroon
INDICATORS LIST
LIST OF TOPICS
PRINT THIS ARTICLE
by David Penn
Volume clues a dip-buying opportunity in cocoa.
Position: N/A
David Penn
Technical Writer for Technical Analysis of STOCKS & COMMODITIES magazine, Working-Money.com, and Traders.com Advantage.
PRINT THIS ARTICLE
VOLUME
Cocoa Pops
12/07/04 08:19:25 AMby David Penn
Volume clues a dip-buying opportunity in cocoa.
Position: N/A
| Trader and trader educator Oliver Velez of Pristine.com famously remarked in a trading seminar a few years ago that "in a bull market, your job as a trader is to buy every single dip. Not a few of them. Not some of them. But all of them. The only question is when." |
| My technical approach using the moving average convergence/divergence histogram (MACDH) is my response to Velez's dictum, a dictum that deserves a place alongside such maxims as "buy low, sell high" and "the trend is your friend." When the MACDH shifts higher or lower in the proper context, it provides a real "go" opportunity -- if the entry target price is reached, you are long or short. All that's left is managing the trade (no small feat; but a different question altogether ...). |

|
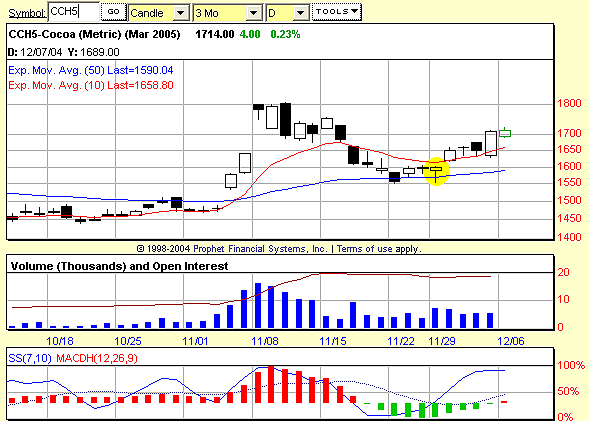
| Figure 1: Cocoa. As the MACDH reverses higher in late November, volume increases. Combined with the potential for support along the 50-day exponential moving average, these technical developments helped clue cocoa traders into a breakout trade. |
| Graphic provided by: Prophet Financial, Inc. |
| |
| Nevertheless, there are supporting clues that can generate confidence in trading a MACDH signal, and volume, predictably enough, is certainly one of them. Consider this daily chart of March cocoa (CCH5), a futures contract I watchlisted back in late November. Cocoa was coming off a high early in November and had corrected down to the 50-day exponential moving average (EMA). It is important to note, however, that cocoa found support at the 50-day. (For more on the power of the 50-day moving average, check out Charles Schaap's Working-Money.com article "The 50-50 Strategy" from December 2003.) |
| It was at this point that I began looking for a reversal upward in the MACDH, one that would provide me with a buy signal and a price entry target. Not only did the upward reversal in the MACDH arrive shortly after March cocoa first tested the 50-day EMA for support, but it was also accompanied by a clear increase in volume. An increase in volume would not have been necessary to confirm any buy signal provided by the MACDH; it was quite the welcome guest. Given the fact that March cocoa found support at the 50-day EMA on large volume (and with a candlestick that hinted at weakness on the part of sellers by virtue of its relatively extended lower shadow), the long opportunity that resulted seemed all the more likely to prove fruitful. |
| How does the trade play out? Given the reversal up in the MACDH on November 29, we use that day's high and that day's range to determine a long entry target. Taking the range of the trading on November 29, dividing it in half and adding that amount to the high of the day provided an entry at 1628 (1603 + [50 / 2]). A buy order at 1628 would have been filled the next day. An exit at the close of the first (relatively) wide range day on December 3 would have got a long trader out near 1710 for a point gain in the neighborhood of 80 points. With each point in cocoa futures worth $10, an 80-point gain per contract is not bad money for a three- to four-day swing trade. |
Technical Writer for Technical Analysis of STOCKS & COMMODITIES magazine, Working-Money.com, and Traders.com Advantage.
| Title: | Technical Writer |
| Company: | Technical Analysis, Inc. |
| Address: | 4757 California Avenue SW |
| Seattle, WA 98116 | |
| Phone # for sales: | 206 938 0570 |
| Fax: | 206 938 1307 |
| Website: | www.Traders.com |
| E-mail address: | DPenn@traders.com |
Traders' Resource Links | |
| Charting the Stock Market: The Wyckoff Method -- Books | |
| Working-Money.com -- Online Trading Services | |
| Traders.com Advantage -- Online Trading Services | |
| Technical Analysis of Stocks & Commodities -- Publications and Newsletters | |
| Working Money, at Working-Money.com -- Publications and Newsletters | |
| Traders.com Advantage -- Publications and Newsletters | |
| Professional Traders Starter Kit -- Software | |
Click here for more information about our publications!
Comments
Date: 12/07/04Rank: 3Comment:

|

Request Information From Our Sponsors
- StockCharts.com, Inc.
- Candle Patterns
- Candlestick Charting Explained
- Intermarket Technical Analysis
- John Murphy on Chart Analysis
- John Murphy's Chart Pattern Recognition
- John Murphy's Market Message
- MurphyExplainsMarketAnalysis-Intermarket Analysis
- MurphyExplainsMarketAnalysis-Visual Analysis
- StockCharts.com
- Technical Analysis of the Financial Markets
- The Visual Investor
- VectorVest, Inc.
- Executive Premier Workshop
- One-Day Options Course
- OptionsPro
- Retirement Income Workshop
- Sure-Fire Trading Systems (VectorVest, Inc.)
- Trading as a Business Workshop
- VectorVest 7 EOD
- VectorVest 7 RealTime/IntraDay
- VectorVest AutoTester
- VectorVest Educational Services
- VectorVest OnLine
- VectorVest Options Analyzer
- VectorVest ProGraphics v6.0
- VectorVest ProTrader 7
- VectorVest RealTime Derby Tool
- VectorVest Simulator
- VectorVest Variator
- VectorVest Watchdog
