HOT TOPICS LIST
- MACD
- Fibonacci
- RSI
- Gann
- ADXR
- Stochastics
- Volume
- Triangles
- Futures
- Cycles
- Volatility
- ZIGZAG
- MESA
- Retracement
- Aroon
INDICATORS LIST
LIST OF TOPICS
PRINT THIS ARTICLE
by Chris Manuell
Gold plays a key role in the intermarket jigsaw puzzle. Given its high negative correlation with the US dollar -- particularly evident in recent months -- the weekly relative strength index highlights the overbought condition of gold.
Position: N/A
Chris Manuell
Chris Manuell spent 7 years as a futures sales/trader for a large investment bank and more recently as a technical analyst for an independent research company. He has a bachelor of economics and graduate diploma in applied finance & investment. Currently enrolled in the CMT program with the MTA.
PRINT THIS ARTICLE
WILDER'S RSI
Gold In The RSI Danger Zone
12/06/04 04:04:39 PMby Chris Manuell
Gold plays a key role in the intermarket jigsaw puzzle. Given its high negative correlation with the US dollar -- particularly evident in recent months -- the weekly relative strength index highlights the overbought condition of gold.
Position: N/A
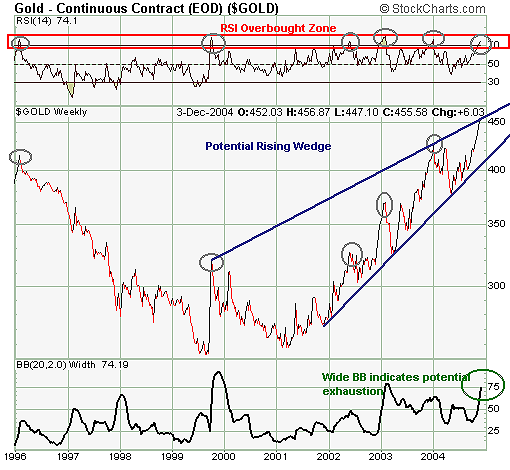
| The weekly line chart of gold has developed a potential bearish rising wedge. The wedge is identified by two converging trendlines that makes up a minimum of five touches of the trendlines. The market is currently testing the upper boundary of the formation taken from the major 1999 closing high. The completion of the wedge formation would require a decisive violation of the lower trendline that commenced in late 2001. A substantial correction would be necessary for a challenge of the lower trendline, and only then would the rising wedge warrant strict consideration. However, weekly oscillators demonstrate the highly overbought nature of gold. |
| The current weekly relative strength index (RSI) reading on gold is at a similar level to five previous retracement points that have occurred since 1996. Currently, weekly gold RSI remains in the overbought zone, and historically, a turndown in RSI from this point should result in a correction. A decent correction may also result in a test of the long-term lower trendline that has kept the four-year rally in motion. |

|
| Figure 1: Weekly Gold Chart. The weekly line chart of gold has developed a potential bearish rising wedge. |
| Graphic provided by: StockCharts.com. |
| |
| The width of the Bollinger Bands can also help provide a measure of the strength of the underlying trend; a wide distance between the bands demonstrates high volatility. The current width in weekly gold is the third highest since 1996, which highlights the potential for bullish exhaustion. A halt and subsequent move down in this indicator would result in a correction in the near term. |
| In summary, gold is reaching historically overbought levels, which should provide a cautionary note to traders of a potential correction. The longer-term bullish trend would only be threatened on a decisive violation of the bullish trendline from 2001. |
Chris Manuell spent 7 years as a futures sales/trader for a large investment bank and more recently as a technical analyst for an independent research company. He has a bachelor of economics and graduate diploma in applied finance & investment. Currently enrolled in the CMT program with the MTA.
| E-mail address: | chrismanuell5@yahoo.co.uk |
Click here for more information about our publications!
Comments
Date: 12/06/04Rank: 5Comment:
Date: 12/07/04Rank: 4Comment:

|

Request Information From Our Sponsors
- StockCharts.com, Inc.
- Candle Patterns
- Candlestick Charting Explained
- Intermarket Technical Analysis
- John Murphy on Chart Analysis
- John Murphy's Chart Pattern Recognition
- John Murphy's Market Message
- MurphyExplainsMarketAnalysis-Intermarket Analysis
- MurphyExplainsMarketAnalysis-Visual Analysis
- StockCharts.com
- Technical Analysis of the Financial Markets
- The Visual Investor
- VectorVest, Inc.
- Executive Premier Workshop
- One-Day Options Course
- OptionsPro
- Retirement Income Workshop
- Sure-Fire Trading Systems (VectorVest, Inc.)
- Trading as a Business Workshop
- VectorVest 7 EOD
- VectorVest 7 RealTime/IntraDay
- VectorVest AutoTester
- VectorVest Educational Services
- VectorVest OnLine
- VectorVest Options Analyzer
- VectorVest ProGraphics v6.0
- VectorVest ProTrader 7
- VectorVest RealTime Derby Tool
- VectorVest Simulator
- VectorVest Variator
- VectorVest Watchdog
