HOT TOPICS LIST
- MACD
- Fibonacci
- RSI
- Gann
- ADXR
- Stochastics
- Volume
- Triangles
- Futures
- Cycles
- Volatility
- ZIGZAG
- MESA
- Retracement
- Aroon
INDICATORS LIST
LIST OF TOPICS
PRINT THIS ARTICLE
by Kevin Hopson
A bullish consolidation pattern may point to higher prices for the stock.
Position: Hold
Kevin Hopson
Kevin has been a technical analyst for roughly 10 years now. Previously, Kevin owned his own business and acted as a registered investment advisor, specializing in energy. He was also a freelance oil analyst for Orient Trading Co., a commodity futures trading firm in Japan. Kevin is currently a freelance writer.
PRINT THIS ARTICLE
SUPPORT & RESISTANCE
Anadarko Petroleum Bounces Off Support Again
12/06/04 09:44:11 AMby Kevin Hopson
A bullish consolidation pattern may point to higher prices for the stock.
Position: Hold
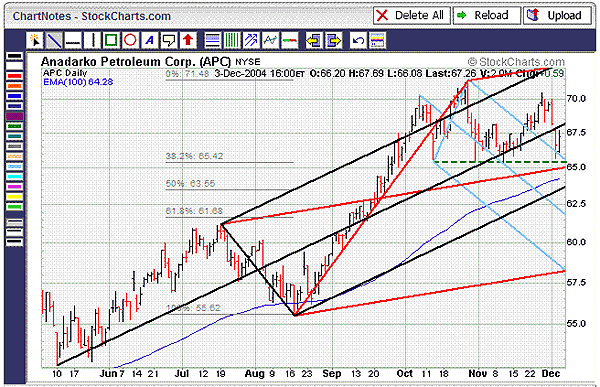
Anadarko Petroleum (APC), like many other oil and gas companies, has seen its stock shine this year. However, if you look at the six-month bar chart, you will notice that Anadarko has been taking a breather from its recent runup in September and October. More specifically, the stock has been moving sideways in what appears to be a bullish trading range. The point & figure chart confirms this as well, as prices have been finding resistance around the $70.00 level and support around the $66.00 level. Figure 1: Anadarko point & figure. The stock has been moving sideways in what appears to be a bullish trading range. The point & figure chart confirms this. |
| The primary reason why Anadarko has been finding resistance around the $70.00 level is significant call option open interest at the December 2004 $70.00 strike price. For example, as of December 3, more than 9,000 call options were outstanding at this strike price. This exceeded put option open interest by more than 7,000 contracts. Because there is a substantial net call position at this strike price, there is more incentive to keep prices below $70.00 in the near term. The reason is that the sellers of these call options will benefit if the stock price closes below $70.00 (out-of-the-money) on December 17. As a result, these call sellers have likely been shorting the stock around the $70.00 level and could continue to do so in the next two weeks. |

|
| Figure 2: Six-month bar chart for Anadarko Petroleum. if you look at the six-month bar chart, note that Anadarko has been taking a breather from its recent runup in September and October. |
| Graphic provided by: StockCharts.com. |
| |
| On the other hand, Anadarko has been finding significant support around the $65.50 level. As you can see in the six-month bar chart, the stock recently formed a quadruple bottom here. This is the site of the 38.2% retracement ($65.42) from the August to October rally and the top blue parallel line. In addition, there is further support right below, as significant put option open interest at the $65.00 strike price and the red median line both come into play here. As a result, Anadarko should continue to find key support in the $65.00 to $66.00 range. |
| In the meantime, the path of least resistance (long term) is higher. Because trading ranges tend to be continuation patterns and the long-term trend is positive, it is likely that Anadarko will break to the upside again. If so, the current trading range formation indicates a potential price target of $83.00 to $88.00. As a result, I would continue to hold shares of Anadarko Petroleum and look to accumulate the stock on further weakness. |
Kevin has been a technical analyst for roughly 10 years now. Previously, Kevin owned his own business and acted as a registered investment advisor, specializing in energy. He was also a freelance oil analyst for Orient Trading Co., a commodity futures trading firm in Japan. Kevin is currently a freelance writer.
| Glen Allen, VA | |
| E-mail address: | hopson_1@yahoo.com |
Click here for more information about our publications!
Comments
Date: 12/07/04Rank: 2Comment:

Request Information From Our Sponsors
- StockCharts.com, Inc.
- Candle Patterns
- Candlestick Charting Explained
- Intermarket Technical Analysis
- John Murphy on Chart Analysis
- John Murphy's Chart Pattern Recognition
- John Murphy's Market Message
- MurphyExplainsMarketAnalysis-Intermarket Analysis
- MurphyExplainsMarketAnalysis-Visual Analysis
- StockCharts.com
- Technical Analysis of the Financial Markets
- The Visual Investor
- VectorVest, Inc.
- Executive Premier Workshop
- One-Day Options Course
- OptionsPro
- Retirement Income Workshop
- Sure-Fire Trading Systems (VectorVest, Inc.)
- Trading as a Business Workshop
- VectorVest 7 EOD
- VectorVest 7 RealTime/IntraDay
- VectorVest AutoTester
- VectorVest Educational Services
- VectorVest OnLine
- VectorVest Options Analyzer
- VectorVest ProGraphics v6.0
- VectorVest ProTrader 7
- VectorVest RealTime Derby Tool
- VectorVest Simulator
- VectorVest Variator
- VectorVest Watchdog
