HOT TOPICS LIST
- MACD
- Fibonacci
- RSI
- Gann
- ADXR
- Stochastics
- Volume
- Triangles
- Futures
- Cycles
- Volatility
- ZIGZAG
- MESA
- Retracement
- Aroon
INDICATORS LIST
LIST OF TOPICS
PRINT THIS ARTICLE
by Chris Manuell
The Dow Jones Utility Average is extremely sensitive to interest rates, and the recent move higher in yields has resulted in a few cracks emerging in the index.
Position: N/A
Chris Manuell
Chris Manuell spent 7 years as a futures sales/trader for a large investment bank and more recently as a technical analyst for an independent research company. He has a bachelor of economics and graduate diploma in applied finance & investment. Currently enrolled in the CMT program with the MTA.
PRINT THIS ARTICLE
CANDLESTICK CHARTING
Dow Utility's Three Black Crows
12/03/04 08:39:20 AMby Chris Manuell
The Dow Jones Utility Average is extremely sensitive to interest rates, and the recent move higher in yields has resulted in a few cracks emerging in the index.
Position: N/A
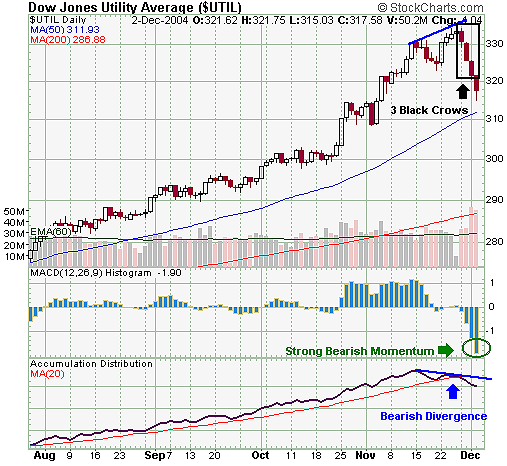
| The Dow Jones Utility Average (DJUA) recently completed the bearish candlestick pattern of the three black crows. This is the appearance of three consecutive dark candles that close at or near their lows following a developed rally. The emergence of this pattern following three-year highs in the DJUA gives the pattern greater credibility -- a strong rejection of higher prices. The three black crows is more suitable for longer-term traders as the market has already moved sharply lower, and prudent traders would wait for a retracement back to the vicinity of the first or second candle of the pattern. |
| The recent push lower in the DJUA was marked by a distinct negative divergence in volume, as indicated by the accumulation/distribution line. Like the majority of volume indicators, the accumulation/distribution lines abide by the principle that volume precedes price. As a result, divergences in the indicator can alert the trader to potential price trend changes. The recent bearish divergence resulted in a sharp correction lower in prices. |

|
| Figure 1: Dow Jones Utility Average daily chart. The utility average may have recently completed a significant high as represented by the three black crows. |
| Graphic provided by: StockCharts.com. |
| |
| The DJUA's daily moving average convergence/divergence (MACD) histogram also highlights the intensity of the recent move lower with a strong swing in momentum as bears took control. The depth of the histogram highlights the strong shift in momentum. The overextended level of the MACD histogram should result in a bounce in the near term as the market alleviates the short-term oversold position. This would result in the DJUA retracing to the region of the first or second candle in the three black crows pattern. |
| In summary, the Dow Jones Utility Average may have recently completed a significant high as represented by the three black crows. A failed test in the vicinity of this pattern could spell danger for this index and also confirm the presence of higher interest rates in the future. |
Chris Manuell spent 7 years as a futures sales/trader for a large investment bank and more recently as a technical analyst for an independent research company. He has a bachelor of economics and graduate diploma in applied finance & investment. Currently enrolled in the CMT program with the MTA.
| E-mail address: | chrismanuell5@yahoo.co.uk |
Click here for more information about our publications!
Comments
Date: 12/05/04Rank: 4Comment:

Request Information From Our Sponsors
- StockCharts.com, Inc.
- Candle Patterns
- Candlestick Charting Explained
- Intermarket Technical Analysis
- John Murphy on Chart Analysis
- John Murphy's Chart Pattern Recognition
- John Murphy's Market Message
- MurphyExplainsMarketAnalysis-Intermarket Analysis
- MurphyExplainsMarketAnalysis-Visual Analysis
- StockCharts.com
- Technical Analysis of the Financial Markets
- The Visual Investor
- VectorVest, Inc.
- Executive Premier Workshop
- One-Day Options Course
- OptionsPro
- Retirement Income Workshop
- Sure-Fire Trading Systems (VectorVest, Inc.)
- Trading as a Business Workshop
- VectorVest 7 EOD
- VectorVest 7 RealTime/IntraDay
- VectorVest AutoTester
- VectorVest Educational Services
- VectorVest OnLine
- VectorVest Options Analyzer
- VectorVest ProGraphics v6.0
- VectorVest ProTrader 7
- VectorVest RealTime Derby Tool
- VectorVest Simulator
- VectorVest Variator
- VectorVest Watchdog
