

HOT TOPICS LIST
- MACD
- Fibonacci
- RSI
- Gann
- ADXR
- Stochastics
- Volume
- Triangles
- Futures
- Cycles
- Volatility
- ZIGZAG
- MESA
- Retracement
- Aroon
INDICATORS LIST
LIST OF TOPICS
PRINT THIS ARTICLE
by Chris Manuell
The US Dollar Index completed a bullish engulfing pattern that may stall the decline in the near term.
Position: N/A
Chris Manuell
Chris Manuell spent 7 years as a futures sales/trader for a large investment bank and more recently as a technical analyst for an independent research company. He has a bachelor of economics and graduate diploma in applied finance & investment. Currently enrolled in the CMT program with the MTA.
PRINT THIS ARTICLE
CANDLESTICK CHARTING
The US Dollar Index's Bullish Engulfing Pattern
12/03/04 08:30:45 AMby Chris Manuell
The US Dollar Index completed a bullish engulfing pattern that may stall the decline in the near term.
Position: N/A
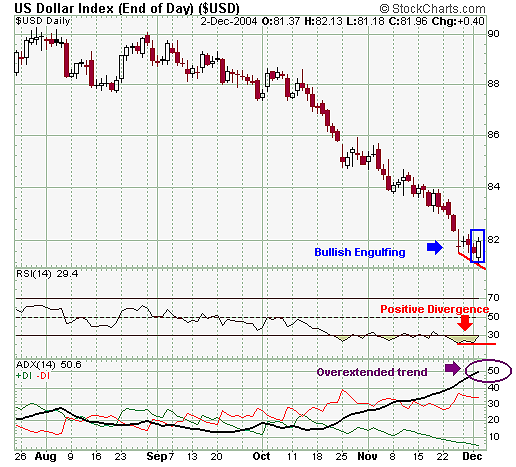
| The US Dollar Index has undergone a sharp decline since breaking from a triangle formation in September -- a corrective bounce could emerge, following a bullish engulfing pattern formed on December 2. Like a digital photograph, the bullish engulfing pattern is a visually descriptive formation that allows instantaneous assessment of the current sentiment. This formation is composed of two opposite colored candles, with the second white candle body engulfing the black body of the previous candle following a downtrend. Bulls have made a directional statement by overcoming the bears, driving prices higher from the open and close above the prior sessions open. The low of the bullish engulfing formation -- 81.18 -- should also provide support and a marker for where the pattern is negated. |
| The US Dollar Index bullish engulfing pattern is also supported by the positive divergence on the daily relative strength index (RSI), as the recent lower price lows were not matched with corresponding lower lows on the price chart. The mastermind behind RSI, J. Welles Wilder, considers divergence "the single most indicative characteristic of the RSI." |
|
| Figure 1: Daily Chart US Dollar Index. The dollar index has undergone a sharp decline since breaking from a triangle formation in September. |
| Graphic provided by: StockCharts.com. |
| |
| Bullish engulfing patterns have a higher probability of success when the market has experienced a sharp trend, such as the recent slide in the US Dollar Index, and is vulnerable to a correction. The high daily average directional movement index (ADX) reading at over 50 is suggestive of such a condition. When the ADX is at a high level and starts to reverse, the prevailing trend is apt to change. A move lower in the US Dollar Index would validate the bullish engulfing pattern and prompt a correction. The daily +DMI is at its lowest level in more than three years, which highlights the force of the recent move. |
Chris Manuell spent 7 years as a futures sales/trader for a large investment bank and more recently as a technical analyst for an independent research company. He has a bachelor of economics and graduate diploma in applied finance & investment. Currently enrolled in the CMT program with the MTA.
| E-mail address: | chrismanuell5@yahoo.co.uk |
Click here for more information about our publications!
Comments
Date:�12/03/04Rank:�5Comment:�
Date:�12/04/04Rank:�4Comment:�however, bullish engulf has seen for $ index ,D- is stilll above 35,politic policy change, take a look one more week
Date:�12/05/04Rank:�4Comment:�
Date:�12/16/04Rank:�2Comment:�

Request Information From Our Sponsors
- StockCharts.com, Inc.
- Candle Patterns
- Candlestick Charting Explained
- Intermarket Technical Analysis
- John Murphy on Chart Analysis
- John Murphy's Chart Pattern Recognition
- John Murphy's Market Message
- MurphyExplainsMarketAnalysis-Intermarket Analysis
- MurphyExplainsMarketAnalysis-Visual Analysis
- StockCharts.com
- Technical Analysis of the Financial Markets
- The Visual Investor
- VectorVest, Inc.
- Executive Premier Workshop
- One-Day Options Course
- OptionsPro
- Retirement Income Workshop
- Sure-Fire Trading Systems (VectorVest, Inc.)
- Trading as a Business Workshop
- VectorVest 7 EOD
- VectorVest 7 RealTime/IntraDay
- VectorVest AutoTester
- VectorVest Educational Services
- VectorVest OnLine
- VectorVest Options Analyzer
- VectorVest ProGraphics v6.0
- VectorVest ProTrader 7
- VectorVest RealTime Derby Tool
- VectorVest Simulator
- VectorVest Variator
- VectorVest Watchdog