HOT TOPICS LIST
- MACD
- Fibonacci
- RSI
- Gann
- ADXR
- Stochastics
- Volume
- Triangles
- Futures
- Cycles
- Volatility
- ZIGZAG
- MESA
- Retracement
- Aroon
INDICATORS LIST
LIST OF TOPICS
PRINT THIS ARTICLE
by Arthur Hill
Gold priced in US dollars has been and remains in a strong bull market. However, gold priced in Japanese yen only recently has broken resistance to continue its bull run.
Position: Buy
Arthur Hill
Arthur Hill is currently editor of TDTrader.com, a website specializing in trading strategies, sector/industry specific breadth stats and overall technical analysis. He passed the Society of Technical Analysts (STA London) diploma exam with distinction is a Certified Financial Technician (CFTe). Prior to TD Trader, he was the Chief Technical Analyst for Stockcharts.com and the main contributor to the ChartSchool.
PRINT THIS ARTICLE
POINT & FIGURE
Yen-Denominated Gold Breakout
12/02/04 08:14:13 AMby Arthur Hill
Gold priced in US dollars has been and remains in a strong bull market. However, gold priced in Japanese yen only recently has broken resistance to continue its bull run.
Position: Buy
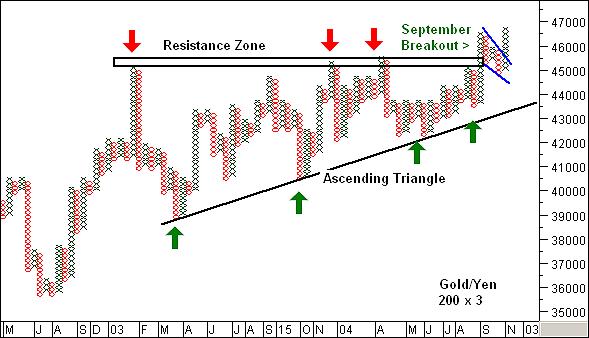
| Figure 1 is a classic point & figure. Each box (X or O) represents 200 yen, and a three-box reversal is required to change directions. |
| As this chart shows, gold/yen met resistance around 45500 in February 2003, January 2004, and May 04 (red arrows). This resistance zone represents overhead supply that prevented gold/yen from moving higher. Each breakout attempt was met with selling pressure and pushed back down. |

|
| Figure 1: Here's a classic point & figure, of gold and the Japanese yen. |
| Graphic provided by: MetaStock. |
| Graphic provided by: Reuters Data. |
| |
| Despite the failures at resistance, buying pressure remained strong on each dip; note the higher lows extending back over the past year and a half (green arrows). This shows buying pressure coming in at higher and higher levels. |
| The overall pattern is a large ascending triangle. These are typically bullish continuation patterns and the September break above the resistance zone confirms the pattern. This is a clear victory by demand over supply and argues for higher prices over the coming months. |
Arthur Hill is currently editor of TDTrader.com, a website specializing in trading strategies, sector/industry specific breadth stats and overall technical analysis. He passed the Society of Technical Analysts (STA London) diploma exam with distinction is a Certified Financial Technician (CFTe). Prior to TD Trader, he was the Chief Technical Analyst for Stockcharts.com and the main contributor to the ChartSchool.
| Title: | Editor |
| Company: | TDTrader.com |
| Address: | Willem Geetsstraat 17 |
| Mechelen, B2800 | |
| Phone # for sales: | 3215345465 |
| Website: | www.tdtrader.com |
| E-mail address: | arthurh@tdtrader.com |
Traders' Resource Links | |
| TDTrader.com has not added any product or service information to TRADERS' RESOURCE. | |
Click here for more information about our publications!
Comments
Date: 12/02/04Rank: 3Comment:

Request Information From Our Sponsors
- StockCharts.com, Inc.
- Candle Patterns
- Candlestick Charting Explained
- Intermarket Technical Analysis
- John Murphy on Chart Analysis
- John Murphy's Chart Pattern Recognition
- John Murphy's Market Message
- MurphyExplainsMarketAnalysis-Intermarket Analysis
- MurphyExplainsMarketAnalysis-Visual Analysis
- StockCharts.com
- Technical Analysis of the Financial Markets
- The Visual Investor
- VectorVest, Inc.
- Executive Premier Workshop
- One-Day Options Course
- OptionsPro
- Retirement Income Workshop
- Sure-Fire Trading Systems (VectorVest, Inc.)
- Trading as a Business Workshop
- VectorVest 7 EOD
- VectorVest 7 RealTime/IntraDay
- VectorVest AutoTester
- VectorVest Educational Services
- VectorVest OnLine
- VectorVest Options Analyzer
- VectorVest ProGraphics v6.0
- VectorVest ProTrader 7
- VectorVest RealTime Derby Tool
- VectorVest Simulator
- VectorVest Variator
- VectorVest Watchdog
