HOT TOPICS LIST
- MACD
- Fibonacci
- RSI
- Gann
- ADXR
- Stochastics
- Volume
- Triangles
- Futures
- Cycles
- Volatility
- ZIGZAG
- MESA
- Retracement
- Aroon
INDICATORS LIST
LIST OF TOPICS
PRINT THIS ARTICLE
by Koos van der Merwe
Gold has become a hedge against the drop in the US dollar. But how high will gold rise -- how far will the dollar fall?
Position: Accumulate
Koos van der Merwe
Has been a technical analyst since 1969, and has worked as a futures and options trader with First Financial Futures in Johannesburg, South Africa.
PRINT THIS ARTICLE
CUP WITH HANDLE
A Target For Gold?
12/01/04 03:51:42 PMby Koos van der Merwe
Gold has become a hedge against the drop in the US dollar. But how high will gold rise -- how far will the dollar fall?
Position: Accumulate
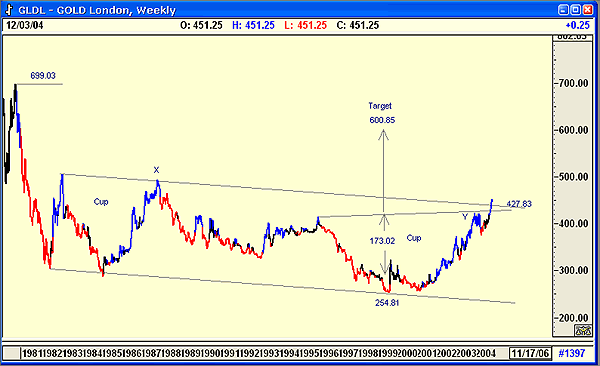
| Figure 1 is a weekly chart of the London gold price from April 1980. The chart shows how gold drifted down from $699.03 to a low of $254.81 before starting to recover. It moved between two trendlines, forming two cup and handle formations, the first of which was not satisfied by a move above the handle at X. With the second cup however, the handle was broken at Y. This now suggests that gold could reach a high of $600.85. (427.83 - 254.81 = 173.02 + 427.83 = 600.85). But how long? |
| The other positive for gold is that the price broke above the upper trendline with not much resistance. Should gold fall, it should now use this trendline as a support level, consolidating in preparation for a further up move. |

|
| Figure 1: Gold with a cup and handle. Gold has become a hedge, but how high will it rise? |
| Graphic provided by: AdvancedGET. |
| |
| Will the dollar weaken further with gold's rise? Actually, it should be the other way around -- will gold continue to rise as the dollar falls, or will gold's rise be caused by world political uncertainty? That we cannot tell, but that gold will rise to above the $600 level is on the charts and should be taken advantage of. |
Has been a technical analyst since 1969, and has worked as a futures and options trader with First Financial Futures in Johannesburg, South Africa.
| Address: | 3256 West 24th Ave |
| Vancouver, BC | |
| Phone # for sales: | 6042634214 |
| E-mail address: | petroosp@gmail.com |
Click here for more information about our publications!
Comments
Date: 12/01/04Rank: 3Comment:
Date: 12/01/04Rank: 5Comment:

Request Information From Our Sponsors
- StockCharts.com, Inc.
- Candle Patterns
- Candlestick Charting Explained
- Intermarket Technical Analysis
- John Murphy on Chart Analysis
- John Murphy's Chart Pattern Recognition
- John Murphy's Market Message
- MurphyExplainsMarketAnalysis-Intermarket Analysis
- MurphyExplainsMarketAnalysis-Visual Analysis
- StockCharts.com
- Technical Analysis of the Financial Markets
- The Visual Investor
- VectorVest, Inc.
- Executive Premier Workshop
- One-Day Options Course
- OptionsPro
- Retirement Income Workshop
- Sure-Fire Trading Systems (VectorVest, Inc.)
- Trading as a Business Workshop
- VectorVest 7 EOD
- VectorVest 7 RealTime/IntraDay
- VectorVest AutoTester
- VectorVest Educational Services
- VectorVest OnLine
- VectorVest Options Analyzer
- VectorVest ProGraphics v6.0
- VectorVest ProTrader 7
- VectorVest RealTime Derby Tool
- VectorVest Simulator
- VectorVest Variator
- VectorVest Watchdog
