HOT TOPICS LIST
- MACD
- Fibonacci
- RSI
- Gann
- ADXR
- Stochastics
- Volume
- Triangles
- Futures
- Cycles
- Volatility
- ZIGZAG
- MESA
- Retracement
- Aroon
INDICATORS LIST
LIST OF TOPICS
PRINT THIS ARTICLE
by Gary Grosschadl
Deutsche Telekom is a huge international player in the wireless market, with international holdings that include T-Mobile in the US.
Position: Buy
Gary Grosschadl
Independent Canadian equities trader and technical analyst based in Peterborough
Ontario, Canada.
PRINT THIS ARTICLE
CHART ANALYSIS
European Telecom Giant Shows A Mature Basing Pattern
11/30/04 09:42:25 AMby Gary Grosschadl
Deutsche Telekom is a huge international player in the wireless market, with international holdings that include T-Mobile in the US.
Position: Buy
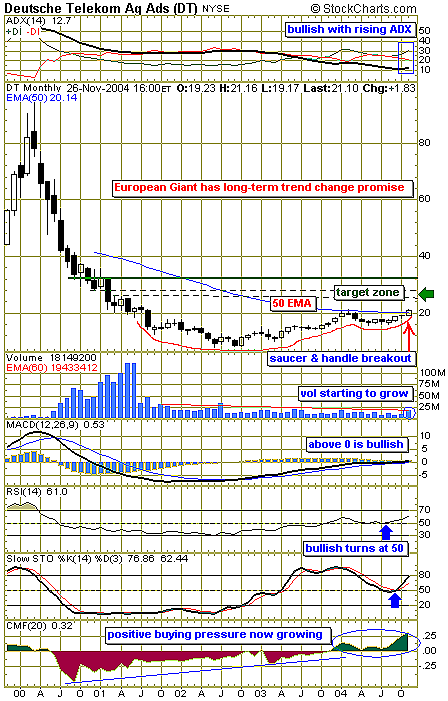
| Too often, traders are reluctant to look at monthly charts, but they can show compelling long-term patterns as illustrated here. This chart aptly reflects the plight of the prior meltdown for the world's high-tech players. From a high near $90, the stock plummeted to below $20 and stayed there for the better part of four years. |
| Now the stock appears to be emerging from a long basing pattern: the longer the basing pattern, the bigger the eventual move. The pattern is a version of the more familiar cup with handle pattern. In this case, it is a saucer with handle pattern with an elongated shape. The breakout could be appearing now, with relative higher volume compared to recent months. Next month's volume should be higher if this indeed is a breakout move. Note how this is the first close above the 50-period exponential moving average (EMA) since the dismal downturn. |

|
| Figure 1: Deutsche Telekom. This monthly chart suggests the possible breakout of a lengthy basing pattern. |
| Graphic provided by: StockCharts.com. |
| |
| Indicators worth commenting on begin with the topmost indicator being the average directional movement index (ADX) / directional index (DI) components of the directional movement indicator (DMI). The DIs are in a bullish position, with a hint of the ADX line moving up to build trend strength. Should the ADX move in between the DI, the promise of a very powerful move would be indicated. The lower indicators all show their own bullish turns, and of particular importance is the Chaikin money flow indicator. This buying/selling pressure indicator shows an obvious shift to the bullish side, clearly showing a switch to buying pressure and interest. |
| Preliminary targets are shown on the chart. The $26 area represents an area of previous support and resistance. The higher target of about $32 also represents a similar area of previous congestion. Once these levels are turned to future support areas, much higher levels are possible. Could this coincide with the next big wireless wave north? Only time will tell. |
Independent Canadian equities trader and technical analyst based in Peterborough
Ontario, Canada.
| Website: | www.whatsonsale.ca/financial.html |
| E-mail address: | gwg7@sympatico.ca |
Click here for more information about our publications!
Comments
Date: 11/30/04Rank: 4Comment:

Request Information From Our Sponsors
- StockCharts.com, Inc.
- Candle Patterns
- Candlestick Charting Explained
- Intermarket Technical Analysis
- John Murphy on Chart Analysis
- John Murphy's Chart Pattern Recognition
- John Murphy's Market Message
- MurphyExplainsMarketAnalysis-Intermarket Analysis
- MurphyExplainsMarketAnalysis-Visual Analysis
- StockCharts.com
- Technical Analysis of the Financial Markets
- The Visual Investor
- VectorVest, Inc.
- Executive Premier Workshop
- One-Day Options Course
- OptionsPro
- Retirement Income Workshop
- Sure-Fire Trading Systems (VectorVest, Inc.)
- Trading as a Business Workshop
- VectorVest 7 EOD
- VectorVest 7 RealTime/IntraDay
- VectorVest AutoTester
- VectorVest Educational Services
- VectorVest OnLine
- VectorVest Options Analyzer
- VectorVest ProGraphics v6.0
- VectorVest ProTrader 7
- VectorVest RealTime Derby Tool
- VectorVest Simulator
- VectorVest Variator
- VectorVest Watchdog
