HOT TOPICS LIST
- MACD
- Fibonacci
- RSI
- Gann
- ADXR
- Stochastics
- Volume
- Triangles
- Futures
- Cycles
- Volatility
- ZIGZAG
- MESA
- Retracement
- Aroon
INDICATORS LIST
LIST OF TOPICS
PRINT THIS ARTICLE
by Gary Grosschadl
A good upleg is under way, breaking through technical points.
Position: Buy
Gary Grosschadl
Independent Canadian equities trader and technical analyst based in Peterborough
Ontario, Canada.
PRINT THIS ARTICLE
CHART ANALYSIS
Power-One Showing Strength
11/30/04 10:07:18 AMby Gary Grosschadl
A good upleg is under way, breaking through technical points.
Position: Buy
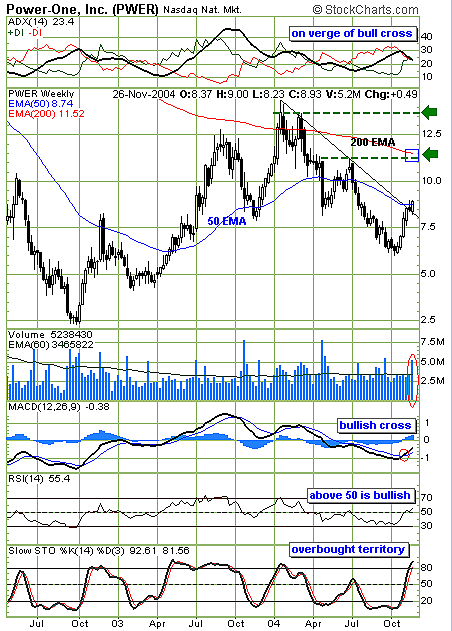
| Power-One is one of the largest manufacturers of power conversion products in the world. The weekly chart shows two recent pushes past notable technical points being a trendline and an important moving average. |
| The volume surge last week demonstrates that traders are noticing a powerful move under way as the stock's 50-period exponential moving average (EMA) was surpassed. During the prior week, an 11-month trendline was penetrated to the upside and then held support. |

|
| Figure 1: Power-One. Longer-term targets can be seen on this weekly chart. |
| Graphic provided by: StockCharts.com. |
| |
| Three other indicators reflect this bullish intent. At the top of the chart, the directional movement indicator (DMI) shows a bullish cross in the making. This signals the bulls once again gaining the upper hand. The ideal bullish situation will exist when the black average directional movement index (ADX) line reverses course and upslopes between the DI- with +DI overhead. For a big move to continue, this will be something to watch for. Below the chart, the moving average convergence/divergence (MACD) shows a bullish cross from a low level. Looking back to October 2002, a similar occurrence led to a large one-year upleg. |
| The relative strength index (RSI) also shows an important development. A move above the key 50 level that held a brief test now is poised higher. The stochastics shows a more sobering view; an overbought situation is deemed when this indicator rises above the 80 level. A reversal and a break below this same 80 level often heralds a downleg under way. |
| Two longer-term targets are shown on Figure 1, the closer target being the $11.50 area relating to the 200-period EMA and a previous resistance area. The higher target just above 13.50 would be feasible once the 200-period EMA becomes a support level. Watch for a stochastic cycle to evolve before this higher target is realized (if it develops), meaning another stochastic reversal from lower levels. |
Independent Canadian equities trader and technical analyst based in Peterborough
Ontario, Canada.
| Website: | www.whatsonsale.ca/financial.html |
| E-mail address: | gwg7@sympatico.ca |
Click here for more information about our publications!
Comments
Date: 11/30/04Rank: 4Comment:
Date: 11/30/04Rank: 4Comment:

|

Request Information From Our Sponsors
- VectorVest, Inc.
- Executive Premier Workshop
- One-Day Options Course
- OptionsPro
- Retirement Income Workshop
- Sure-Fire Trading Systems (VectorVest, Inc.)
- Trading as a Business Workshop
- VectorVest 7 EOD
- VectorVest 7 RealTime/IntraDay
- VectorVest AutoTester
- VectorVest Educational Services
- VectorVest OnLine
- VectorVest Options Analyzer
- VectorVest ProGraphics v6.0
- VectorVest ProTrader 7
- VectorVest RealTime Derby Tool
- VectorVest Simulator
- VectorVest Variator
- VectorVest Watchdog
- StockCharts.com, Inc.
- Candle Patterns
- Candlestick Charting Explained
- Intermarket Technical Analysis
- John Murphy on Chart Analysis
- John Murphy's Chart Pattern Recognition
- John Murphy's Market Message
- MurphyExplainsMarketAnalysis-Intermarket Analysis
- MurphyExplainsMarketAnalysis-Visual Analysis
- StockCharts.com
- Technical Analysis of the Financial Markets
- The Visual Investor
