HOT TOPICS LIST
- MACD
- Fibonacci
- RSI
- Gann
- ADXR
- Stochastics
- Volume
- Triangles
- Futures
- Cycles
- Volatility
- ZIGZAG
- MESA
- Retracement
- Aroon
INDICATORS LIST
LIST OF TOPICS
PRINT THIS ARTICLE
by Kevin Hopson
Crude oil prices recently bounced off support around the $45.00 level but now face resistance at $50.00.
Position: Hold
Kevin Hopson
Kevin has been a technical analyst for roughly 10 years now. Previously, Kevin owned his own business and acted as a registered investment advisor, specializing in energy. He was also a freelance oil analyst for Orient Trading Co., a commodity futures trading firm in Japan. Kevin is currently a freelance writer.
PRINT THIS ARTICLE
TECHNICAL ANALYSIS
The Short-Term Outlook For Crude Oil
11/29/04 08:19:54 AMby Kevin Hopson
Crude oil prices recently bounced off support around the $45.00 level but now face resistance at $50.00.
Position: Hold
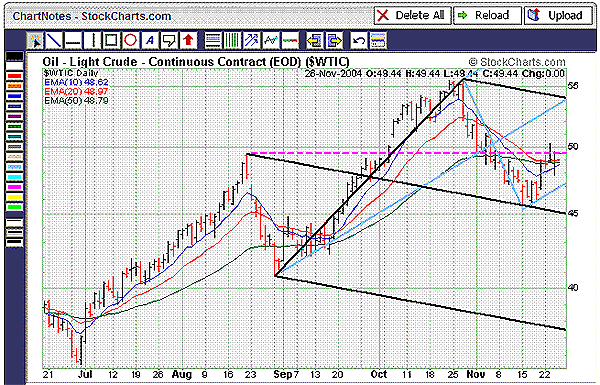
| As you can see in the six-month chart, the continuous crude oil futures contract ($WTIC) recently put in a bottom around the $45.00 level. This was not a surprise, as the black median line acted as an opportune bouncing point for prices. In addition, with the exception of the January $40.00 strike price, the highest amount of put option open interest currently resides at the $45.00 strike price. Since the sellers of these put options had incentive to keep prices above the related strike price ($45.00), the contract found further support at this level. |
| Now that prices have started to recover, the contract is facing resistance around the $50.00 level. This is the site of broken support, significant option open interest, and a key retracement level from the recent decline. For example, notice how prices during the November correction moved below the dotted purple line. This was the site of October's double-top breakout point. Broken resistance levels tend to act as support because those traders who sold prior to the breakout want to buy back in at the same price. Unfortunately, this support level failed to hold, and prices are once again finding resistance here. |

|
| Figure 1: Oil, light crude |
| Graphic provided by: StockCharts.com. |
| |
| Also providing resistance at the $50.00 level is a substantial amount of option open interest. More specifically, the January $50.00 strike price is home to nearly 13,000 option contracts, with the majority of these contracts being call options. This means there will likely be a battle between the bulls and bears at the $50.00 strike price, which is also a key psychological resistance level. If that is not enough, the 50% retracement from the October to November decline comes into play around the $50.50 level. This retracement level turned back prices last week. |
| On the other hand, the contract is now trading back above its 10-day, 20-day, and 50-day moving averages, all of which are starting to turn higher. As long as prices do not pull back to the lower parallel line of the blue pitchfork ($47.00), which would indicate weakness and the possibility of another breakdown, the contract should look to overcome resistance in the near term. For example, if the contract can move above the $50.50 and $51.75 levels (both Fibonacci retracements), prices could eventually make their way up to $54.00. This is the site of the blue median line and the top black parallel line. |
Kevin has been a technical analyst for roughly 10 years now. Previously, Kevin owned his own business and acted as a registered investment advisor, specializing in energy. He was also a freelance oil analyst for Orient Trading Co., a commodity futures trading firm in Japan. Kevin is currently a freelance writer.
| Glen Allen, VA | |
| E-mail address: | hopson_1@yahoo.com |
Click here for more information about our publications!
Comments
Date: 11/29/04Rank: 2Comment:
Date: 11/30/04Rank: 4Comment:
Date: 11/30/04Rank: 5Comment:

|

Request Information From Our Sponsors
- StockCharts.com, Inc.
- Candle Patterns
- Candlestick Charting Explained
- Intermarket Technical Analysis
- John Murphy on Chart Analysis
- John Murphy's Chart Pattern Recognition
- John Murphy's Market Message
- MurphyExplainsMarketAnalysis-Intermarket Analysis
- MurphyExplainsMarketAnalysis-Visual Analysis
- StockCharts.com
- Technical Analysis of the Financial Markets
- The Visual Investor
- VectorVest, Inc.
- Executive Premier Workshop
- One-Day Options Course
- OptionsPro
- Retirement Income Workshop
- Sure-Fire Trading Systems (VectorVest, Inc.)
- Trading as a Business Workshop
- VectorVest 7 EOD
- VectorVest 7 RealTime/IntraDay
- VectorVest AutoTester
- VectorVest Educational Services
- VectorVest OnLine
- VectorVest Options Analyzer
- VectorVest ProGraphics v6.0
- VectorVest ProTrader 7
- VectorVest RealTime Derby Tool
- VectorVest Simulator
- VectorVest Variator
- VectorVest Watchdog
