HOT TOPICS LIST
- MACD
- Fibonacci
- RSI
- Gann
- ADXR
- Stochastics
- Volume
- Triangles
- Futures
- Cycles
- Volatility
- ZIGZAG
- MESA
- Retracement
- Aroon
INDICATORS LIST
LIST OF TOPICS
PRINT THIS ARTICLE
by David Penn
A running positive divergence propels oil service HOLDRS to new highs.
Position: N/A
David Penn
Technical Writer for Technical Analysis of STOCKS & COMMODITIES magazine, Working-Money.com, and Traders.com Advantage.
PRINT THIS ARTICLE
STOCHASTICS
Divergences Drive OIH Up
11/23/04 01:39:50 PMby David Penn
A running positive divergence propels oil service HOLDRS to new highs.
Position: N/A
| If you've been reading Traders.com Advantage in November, you've been treated to a number of insightful articles on the technical analysis of various oil industry stocks (see any number of articles by Kevin Hopson, most recently "Range Resources At Key Inflection Point," Traders.com Advantage, November 18, 2004; RRC is enjoying a 9% breakout day as I write). Here I want to take a quick look at the current move up in oil service stocks in general, and an even closer look at the tools that traders could have used to anticipate it. |
| So often, traders see a perfect setup after the fact and fret that they will never see such an ideal situation again. I confess that's a bit how I felt in missing the Bush bounce in late October, one that was telegraphed by a double or running positive stochastic divergence, among other factors (see my "Divergences And The Bush Bounce," Traders.com Advantage, November 9, 2004). But markets are made of people, and while people come in seemingly infinite varieties, there are types and patterns of behavior, and those types and patterns repeat themselves -- and no less infinitely so. |

|
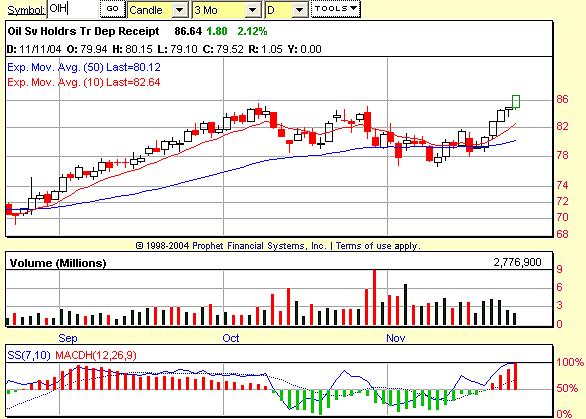
| Figure 1: Oil Service HOLDRs. Two sets of positive divergences — between the October and November lows in the intermediate term and between the early November and late November lows in the shorter-term — anticipate a move higher in OIH. Note the support provided by the 50-day exponential moving average during the decline from the early October highs to the mid-November lows, as well as the potential for moving average support in the form of the 10-day exponential moving average during the breakout. |
| Graphic provided by: Prophet Financial, Inc. |
| |
| What appears to have repeated itself is the same stochastic pattern that set up the Bush bounce in stocks in late October. Recall that the bounce consisted of a month-to-month positive stochastic divergence (September lows to October lows), which grew into an intramonth positive stochastic divergence (early October lows to late October lows). Here, we have the same sort of pattern in the OIH: a month-to-month positive stochastic divergence (October lows to November lows) and an intramonth positive stochastic divergence (early November lows to mid-November lows). So far, the results are the same: a sudden, powerful move higher. |
Technical Writer for Technical Analysis of STOCKS & COMMODITIES magazine, Working-Money.com, and Traders.com Advantage.
| Title: | Technical Writer |
| Company: | Technical Analysis, Inc. |
| Address: | 4757 California Avenue SW |
| Seattle, WA 98116 | |
| Phone # for sales: | 206 938 0570 |
| Fax: | 206 938 1307 |
| Website: | www.Traders.com |
| E-mail address: | DPenn@traders.com |
Traders' Resource Links | |
| Charting the Stock Market: The Wyckoff Method -- Books | |
| Working-Money.com -- Online Trading Services | |
| Traders.com Advantage -- Online Trading Services | |
| Technical Analysis of Stocks & Commodities -- Publications and Newsletters | |
| Working Money, at Working-Money.com -- Publications and Newsletters | |
| Traders.com Advantage -- Publications and Newsletters | |
| Professional Traders Starter Kit -- Software | |
Click here for more information about our publications!
Comments
Date: 11/24/04Rank: 3Comment:

Request Information From Our Sponsors
- StockCharts.com, Inc.
- Candle Patterns
- Candlestick Charting Explained
- Intermarket Technical Analysis
- John Murphy on Chart Analysis
- John Murphy's Chart Pattern Recognition
- John Murphy's Market Message
- MurphyExplainsMarketAnalysis-Intermarket Analysis
- MurphyExplainsMarketAnalysis-Visual Analysis
- StockCharts.com
- Technical Analysis of the Financial Markets
- The Visual Investor
- VectorVest, Inc.
- Executive Premier Workshop
- One-Day Options Course
- OptionsPro
- Retirement Income Workshop
- Sure-Fire Trading Systems (VectorVest, Inc.)
- Trading as a Business Workshop
- VectorVest 7 EOD
- VectorVest 7 RealTime/IntraDay
- VectorVest AutoTester
- VectorVest Educational Services
- VectorVest OnLine
- VectorVest Options Analyzer
- VectorVest ProGraphics v6.0
- VectorVest ProTrader 7
- VectorVest RealTime Derby Tool
- VectorVest Simulator
- VectorVest Variator
- VectorVest Watchdog
