HOT TOPICS LIST
- MACD
- Fibonacci
- RSI
- Gann
- ADXR
- Stochastics
- Volume
- Triangles
- Futures
- Cycles
- Volatility
- ZIGZAG
- MESA
- Retracement
- Aroon
INDICATORS LIST
LIST OF TOPICS
PRINT THIS ARTICLE
by Chris Manuell
The Banking Index completed a bearish engulfing pattern on the weekly chart at the March peak, which may presage lower prices.
Position: N/A
Chris Manuell
Chris Manuell spent 7 years as a futures sales/trader for a large investment bank and more recently as a technical analyst for an independent research company. He has a bachelor of economics and graduate diploma in applied finance & investment. Currently enrolled in the CMT program with the MTA.
PRINT THIS ARTICLE
CANDLESTICK CHARTING
Banking Index Weekly: Bullish Engulfing
11/23/04 09:42:23 AMby Chris Manuell
The Banking Index completed a bearish engulfing pattern on the weekly chart at the March peak, which may presage lower prices.
Position: N/A
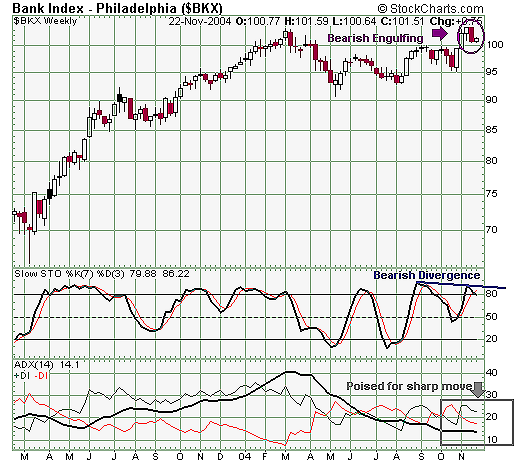
| The Bank index demonstrated a failure to sustain a move through the March highs recently and also engineered a top reversal signal -- the bearish engulfing pattern. The essence of this candlestick pattern is that the bears have besieged the bulls and reversed the prior trend with a strong move lower. The bullish engulfing pattern composes two candles and the second dark candle envelopes the first white candle, marking a change in sentiment. The Banking Index bullish engulfing pattern is the star of this show; however, it also has a strong supporting cast that could unveil a potential hit. |
| The Banking Index bearish engulfing pattern makes up two candles, and each of these individual candles are bearish reversal signals. The first candle is a hanging man -- with a similar shape to the hammer -- and it has bearish ramifications when emerging at significant highs. In JAPANESE CANDLESTICK CHARTING TECHNIQUES, Steve Nison recommends that confirmation is required for this pattern and he likes to see the next session close under the hanging man's real body. This confirmation was achieved by the following candle as it closed beneath the hanging man's body, and in the process completed a bearish belt-hold. The bearish belt-hold is a candle that opens on or near its high and moves lower to close on or near its low. The bearish belt-hold also marked the completion of the bearish engulfing pattern. These bearish candles may make it difficult for bulls to overcome the resistance at 103.73 -- high of the bullish engulfing pattern -- and could allow a potential reversal to unfold. |

|
| Figure 1: Bank Index Weekly Chart |
| Graphic provided by: StockCharts.com. |
| |
| The Banking Index bullish engulfing pattern also formed a tweezers top. The tweezers top is formed when two or more consecutive candles have matching highs. The Banking Index achieved this with the hanging man high at 103.73 and the bearish belt-hold high at 103.72. I am not sure even Elliott Spitzer would begrudge that one point from the ideal formation. The emergence on the weekly chart also provides more standing. |
| The bearish divergence on the slow stochastics also supports the potential for a reversal with the recent higher high on the price chart not supported by the corresponding lower high on the indicator. The slow stochastic bearish divergence that materialized in the runup to the March highs resulted in a tidy correction. The directional movement index (DMI) is also significantly placed, with the average directional movement index (ADX) languishing beneath 20 and also below the +DMI and -DMI. In TRADING FOR A LIVING, Alexander Elder notes that this provides the base for some strong moves. A pushup by the ADX above the DMI lines would be the stimulus for a big move. |
| The beauty of applying technical analysis to your trading is its ability to provide a guide for when you have made a mistake and the market determines when your analysis is wrong. In the case of the Banking Index, a decisive close above the recent high of the bullish engulfing pattern at 103.73 would negate the bearish view. A successful correction and move lower would inspire speculation of a potential double top unfolding in the Banking Index. |
Chris Manuell spent 7 years as a futures sales/trader for a large investment bank and more recently as a technical analyst for an independent research company. He has a bachelor of economics and graduate diploma in applied finance & investment. Currently enrolled in the CMT program with the MTA.
| E-mail address: | chrismanuell5@yahoo.co.uk |
Click here for more information about our publications!
Comments
Date: 11/23/04Rank: 3Comment:
Date: 11/27/04Rank: 5Comment:

Request Information From Our Sponsors
- VectorVest, Inc.
- Executive Premier Workshop
- One-Day Options Course
- OptionsPro
- Retirement Income Workshop
- Sure-Fire Trading Systems (VectorVest, Inc.)
- Trading as a Business Workshop
- VectorVest 7 EOD
- VectorVest 7 RealTime/IntraDay
- VectorVest AutoTester
- VectorVest Educational Services
- VectorVest OnLine
- VectorVest Options Analyzer
- VectorVest ProGraphics v6.0
- VectorVest ProTrader 7
- VectorVest RealTime Derby Tool
- VectorVest Simulator
- VectorVest Variator
- VectorVest Watchdog
- StockCharts.com, Inc.
- Candle Patterns
- Candlestick Charting Explained
- Intermarket Technical Analysis
- John Murphy on Chart Analysis
- John Murphy's Chart Pattern Recognition
- John Murphy's Market Message
- MurphyExplainsMarketAnalysis-Intermarket Analysis
- MurphyExplainsMarketAnalysis-Visual Analysis
- StockCharts.com
- Technical Analysis of the Financial Markets
- The Visual Investor
