HOT TOPICS LIST
- MACD
- Fibonacci
- RSI
- Gann
- ADXR
- Stochastics
- Volume
- Triangles
- Futures
- Cycles
- Volatility
- ZIGZAG
- MESA
- Retracement
- Aroon
INDICATORS LIST
LIST OF TOPICS
PRINT THIS ARTICLE
by David Penn
A positive divergence set up a bounce in October. Will a trendline break in November anticipate a breakdown?
Position: N/A
David Penn
Technical Writer for Technical Analysis of STOCKS & COMMODITIES magazine, Working-Money.com, and Traders.com Advantage.
PRINT THIS ARTICLE
SECTOR INVESTING
Banks Bounce, Then Break Down
11/23/04 09:28:50 AMby David Penn
A positive divergence set up a bounce in October. Will a trendline break in November anticipate a breakdown?
Position: N/A
| If you're trying to decide whether the economy is experiencing more than its fair share of inflationary pressures, then the price of gold is one place supply-side economists have encouraged the rest of us to look. But if you're trying to decide whether our finance-based economy is doing well, then most industry sector and intermarket analysts will point you in one direction: the financial sector. |
| In a world when companies like General Electric and General Motors are profitable as much from the financing of goods and services as they are from the manufacture of goods and services, the health of the financial sector -- money center banks, regional banks, savings and loans, brokers, and so forth -- is paramount. In fact, many market commentators have gone so far as to suggest that all a trader or investor needs to know is "How are the banks and brokers doing?" If the answer is "well" or "very well," then the response, typically, is to buy stocks. Early in Marty Schwartz's excellent memoir, PIT BULL, Schwartz talks about trading options in oil companies like Mesa Petroleum in the late 1970s and early 1980s. But once it was clear that the recession of 1981-82 was over, the Reagan agenda on track and the bull market back, Schwartz and his pit pals switched to trading Merrill Lynch options. This just underscores the point: In a market moving higher, the financials are the place to be. |

|
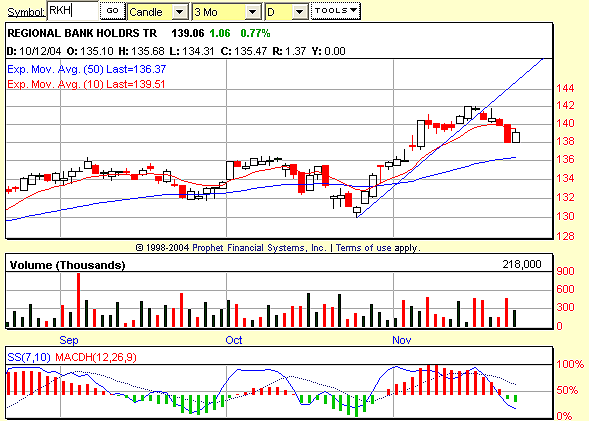
| Figure 1: The regional banks HOLDRS (RKH) slipped under its 10-day exponential moving average late in November after breaking the trendline that guided its nearly month-long rally. A negative stochastic divergence also threatens RKH's ability to regain and hold ground north of 140. |
| Graphic provided by: Prophet Financial, Inc. |
| |
| Which brings us to RKH, the HOLDRs for the regional banks. Although RKH didn't have the same double, running positive stochastic divergence as the broader market indexes, the divergence between RKH's consecutively lower troughs in September and October and the 7,10 stochastic's consecutively higher troughs in September and October was telling and positive. Financial stocks, per RKH, shot up from their October lows, breaking out in early November and moving steadily higher for a 10% gain by mid-month. |
| Since that time, RKH has fared poorer. The exchange-traded fund broke its month-long trendline on November 16 and, after sending up a shooting star-like candlestick the next day, began a decline that has already retraced a third of the rally from the October bottom. It also appears that this move down might have been telegraphed by a negative divergence between the consecutively higher price peaks in RKH from early November and mid-November, and the consecutively lower price peaks in the stochastic (note that there appear to be three peaks in the 7,10 stochastic; the first and third are the relevant ones as far as the negative divergence is concerned). |
| Currently, the bulls have two objectives. The first is to defend the 138 level, which was sorely tested in Friday's trading. The second is to retrace the Friday decline with an advance beyond the 140 level. There is plenty of resistance in the form of past highs that could prove daunting for any rally in RKH and, as such, a further retreat by the bulls to support at the 50-day exponential moving average near 136.5 should not be unexpected before any serious attempt to set a new high for the autumn rally in RKH. |
Technical Writer for Technical Analysis of STOCKS & COMMODITIES magazine, Working-Money.com, and Traders.com Advantage.
| Title: | Technical Writer |
| Company: | Technical Analysis, Inc. |
| Address: | 4757 California Avenue SW |
| Seattle, WA 98116 | |
| Phone # for sales: | 206 938 0570 |
| Fax: | 206 938 1307 |
| Website: | www.Traders.com |
| E-mail address: | DPenn@traders.com |
Traders' Resource Links | |
| Charting the Stock Market: The Wyckoff Method -- Books | |
| Working-Money.com -- Online Trading Services | |
| Traders.com Advantage -- Online Trading Services | |
| Technical Analysis of Stocks & Commodities -- Publications and Newsletters | |
| Working Money, at Working-Money.com -- Publications and Newsletters | |
| Traders.com Advantage -- Publications and Newsletters | |
| Professional Traders Starter Kit -- Software | |
Click here for more information about our publications!
Comments
Date: 11/23/04Rank: 3Comment:

Request Information From Our Sponsors
- StockCharts.com, Inc.
- Candle Patterns
- Candlestick Charting Explained
- Intermarket Technical Analysis
- John Murphy on Chart Analysis
- John Murphy's Chart Pattern Recognition
- John Murphy's Market Message
- MurphyExplainsMarketAnalysis-Intermarket Analysis
- MurphyExplainsMarketAnalysis-Visual Analysis
- StockCharts.com
- Technical Analysis of the Financial Markets
- The Visual Investor
- VectorVest, Inc.
- Executive Premier Workshop
- One-Day Options Course
- OptionsPro
- Retirement Income Workshop
- Sure-Fire Trading Systems (VectorVest, Inc.)
- Trading as a Business Workshop
- VectorVest 7 EOD
- VectorVest 7 RealTime/IntraDay
- VectorVest AutoTester
- VectorVest Educational Services
- VectorVest OnLine
- VectorVest Options Analyzer
- VectorVest ProGraphics v6.0
- VectorVest ProTrader 7
- VectorVest RealTime Derby Tool
- VectorVest Simulator
- VectorVest Variator
- VectorVest Watchdog
