HOT TOPICS LIST
- MACD
- Fibonacci
- RSI
- Gann
- ADXR
- Stochastics
- Volume
- Triangles
- Futures
- Cycles
- Volatility
- ZIGZAG
- MESA
- Retracement
- Aroon
INDICATORS LIST
LIST OF TOPICS
PRINT THIS ARTICLE
by David Penn
A negative divergence develops from the November leg of SBC's autumn rally.
Position: N/A
David Penn
Technical Writer for Technical Analysis of STOCKS & COMMODITIES magazine, Working-Money.com, and Traders.com Advantage.
PRINT THIS ARTICLE
THE DIAMOND
Telecoms Top Out?
11/23/04 09:06:27 AMby David Penn
A negative divergence develops from the November leg of SBC's autumn rally.
Position: N/A
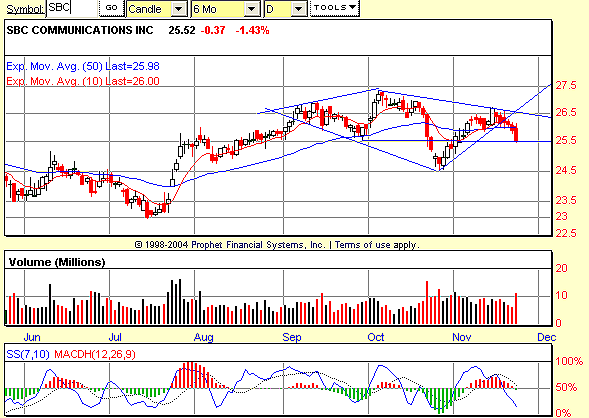
| It's been nearly a month since stocks bottomed late in October, so it can be helpful to see how some stocks have fared from then to now. One stock that has caught my attention is SBC Communications (SBC), a Dow component and component of the telecom HOLDRs (TTH). SBC suffered a sharp selloff in the second half of October, a decline that was accompanied by a three-month high spike in volume midway through the collapse. |
| Often, outsized volume spikes during declines are signs that a correction may be running its course. The thinking in such instances is that if all the sellers pile in, then who is left to sell? As the chart of SBC shows, sellers were able to take an additional point off of SBC in the wake of the big volume day. So while market action on that day (October 21) might not represent a classic selling climax, it is clear that sellers exhausted themselves. |

|
| Figure 1: SBC. Although the magnitude of the October decline made a head and shoulders top pattern more difficult to complete, the October decline does help create a potential diamond top for shares of SBC Communications. Support at 25.5 appears critical. |
| Graphic provided by: Prophet Financial, Inc. |
| |
| Since those days of exhaustion, sellers have stepped aside and let buyers bid shares of SBC back up. And in a little over two weeks, SBC had gained two points, retracing most but not all of its October decline. There are a few things about this rally in SBC, however, that are probably worth noting. First, volume tended to contract during the most powerful portion of SBC's rally from early November to mid-month. Rallies with declining volumes tend to be considered weaker (or even suspect) than rallies that feature advancing volumes. |
| Although SBC has climbed back above its 10- and 50-day exponential moving averages (EMAs), note how SBC's price makes higher highs in November while the stochastic makes a pair of lower highs. This negative divergence between price and the 7,10 stochastic might be the next best thing to overhead resistance, at least as far as SBC bears are concerned. While negative divergences can be defied, they do help create an unequivocal risk/reward scenario for aggressive traders and investors. As such, any bearish call on SBC based on the negative divergence would be negated if SBC were to move above the high of the higher of the two price peaks -- in this case, at about 26.70, roughly a buck and a quarter away from the Monday, November 22nd close. |
| Monday also saw a pickup in volume. Interestingly enough, this event comes at about the same level as did the last big volume surge in mid- to late October. Whether this means that SBC is at the same point in its decline as it was in mid- to late October (that is, anywhere from halfway to almost done) is anybody's guess. A somewhat more certain guess on SBC's potential for further declines comes from an analysis of the stock's diamond top (nee head and shoulders top). Taking the formation size of about three and subtracting that from the value at the breakout level of approximately 25.75 gives a minimum downside of 22.75. A decline of this magnitude would set up a test of SBC's lows from July 2004. |
Technical Writer for Technical Analysis of STOCKS & COMMODITIES magazine, Working-Money.com, and Traders.com Advantage.
| Title: | Technical Writer |
| Company: | Technical Analysis, Inc. |
| Address: | 4757 California Avenue SW |
| Seattle, WA 98116 | |
| Phone # for sales: | 206 938 0570 |
| Fax: | 206 938 1307 |
| Website: | www.Traders.com |
| E-mail address: | DPenn@traders.com |
Traders' Resource Links | |
| Charting the Stock Market: The Wyckoff Method -- Books | |
| Working-Money.com -- Online Trading Services | |
| Traders.com Advantage -- Online Trading Services | |
| Technical Analysis of Stocks & Commodities -- Publications and Newsletters | |
| Working Money, at Working-Money.com -- Publications and Newsletters | |
| Traders.com Advantage -- Publications and Newsletters | |
| Professional Traders Starter Kit -- Software | |
Click here for more information about our publications!
Comments
Date: 11/23/04Rank: 3Comment:

Request Information From Our Sponsors
- StockCharts.com, Inc.
- Candle Patterns
- Candlestick Charting Explained
- Intermarket Technical Analysis
- John Murphy on Chart Analysis
- John Murphy's Chart Pattern Recognition
- John Murphy's Market Message
- MurphyExplainsMarketAnalysis-Intermarket Analysis
- MurphyExplainsMarketAnalysis-Visual Analysis
- StockCharts.com
- Technical Analysis of the Financial Markets
- The Visual Investor
- VectorVest, Inc.
- Executive Premier Workshop
- One-Day Options Course
- OptionsPro
- Retirement Income Workshop
- Sure-Fire Trading Systems (VectorVest, Inc.)
- Trading as a Business Workshop
- VectorVest 7 EOD
- VectorVest 7 RealTime/IntraDay
- VectorVest AutoTester
- VectorVest Educational Services
- VectorVest OnLine
- VectorVest Options Analyzer
- VectorVest ProGraphics v6.0
- VectorVest ProTrader 7
- VectorVest RealTime Derby Tool
- VectorVest Simulator
- VectorVest Variator
- VectorVest Watchdog
