HOT TOPICS LIST
- MACD
- Fibonacci
- RSI
- Gann
- ADXR
- Stochastics
- Volume
- Triangles
- Futures
- Cycles
- Volatility
- ZIGZAG
- MESA
- Retracement
- Aroon
INDICATORS LIST
LIST OF TOPICS
PRINT THIS ARTICLE
by Gary Grosschadl
Gold prices have been advancing nicely since breaking above $430 several weeks ago. Now there is a hint of weakness.
Position: Hold
Gary Grosschadl
Independent Canadian equities trader and technical analyst based in Peterborough
Ontario, Canada.
PRINT THIS ARTICLE
CHART ANALYSIS
This Gold Index Hints At Retracement
11/22/04 09:10:14 AMby Gary Grosschadl
Gold prices have been advancing nicely since breaking above $430 several weeks ago. Now there is a hint of weakness.
Position: Hold
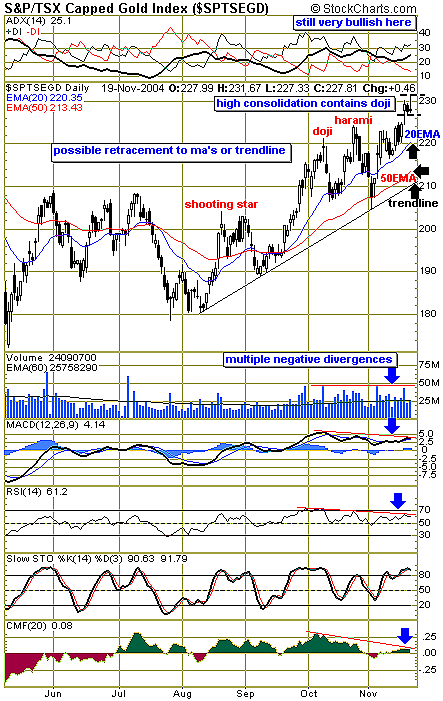
| On a weekly (end of day) basis, the gold price (the gold continuous contract, $GOLD) has climbed for five continuous weeks. The largest increase was last week at $9.21, to close of $447.05 (spot price 446.40). The first hint that this move may have gotten ahead of itself comes from one of the gold index charts, specifically the TSX (Toronto) Gold Index. In a Traders.com Advantage article a few months ago (September 22, "XAU Gold Index Tries A Breakout"), I was bullish for a possible substantial move higher, and this level has now been exceeded. A retracement after a healthy rise is not out of the question. |
| I monitor different gold indexes for advance clues to what may lie ahead. The TSX Gold Index hints at a possible retracement shaping up. This is still an uptrend, so until the trendline is broken, longer-term traders will probably stay with the trade. Shorter-term traders, on the other hand, will not overstay the party much longer, and this may be the mechanism that causes a retracement toward the trendline shown on this daily chart or the 50-day exponential moving average (EMA). A briefer retracement to find support at the 20-day EMA is also a possibility. |

|
| Figure 1: This daily chart hints at a retracement IF the high consolidation breaks to the downside. |
| Graphic provided by: StockCharts.com. |
| |
| The most bullish indicator on the chart (besides the high consolidation) is shown by the topmost graph of the average directional movement index (ADX) and the directional index (DI) setup. The ideal condition is shown as being an upsloping ADX, above 25, and between the DIs with + DI on top. This indicates a strong uptrend. This is not a short-term indicator; rather, it is a better medium- to longer-term indicator. With a strong uptrend in place, a resumption of this bullish bias is likely to occur after a normal retracement to support. Three previous downlegs were instigated by bearish candlestick patterns, noted in red as a shooting star, harami, and doji. Now while the index is in a high consolidation pattern, another doji appears. Dojis are always carefully watched after sizable uplegs or downlegs as they can be precursors to reversals. Should this be confirmed by a downside move in the next few trading sessions, then a retracement is likely beginning. |
| What makes a retracement more likely is the fact that several negative divergences have emerged on the lower indicators and the trading volume. When a stock or index moves higher on lower volume, it signals less conviction on the part of the bulls that the move is sustainable. The following indicators all show negative divergences to recent price action: MACD (moving average convergence/divergence), RSI (relative strength index), and CMF (Chaikin money flow). Multiple negative divergences often are reliable signs of a coming downleg. As long as the trendline is not violated, the uptrend remains in place. Whether a retracement comes down that far or finds higher support remains to be seen. |
| However, first things first. The high consolidation needs to be confirmed either way. A move above the doji negates the anticipated retracement. |
Independent Canadian equities trader and technical analyst based in Peterborough
Ontario, Canada.
| Website: | www.whatsonsale.ca/financial.html |
| E-mail address: | gwg7@sympatico.ca |
Click here for more information about our publications!
Comments
Date: 11/22/04Rank: 5Comment:
Date: 11/23/04Rank: 4Comment:
Date: 11/23/04Rank: 5Comment: The article provides a necessary alert so that both short-term and medium- or long-term traders are watchful for the appropriate indicators to measure price action.
The article provides a good array of indicators and explains the description functions well.
Date: 11/30/04Rank: 5Comment:

|

Request Information From Our Sponsors
- StockCharts.com, Inc.
- Candle Patterns
- Candlestick Charting Explained
- Intermarket Technical Analysis
- John Murphy on Chart Analysis
- John Murphy's Chart Pattern Recognition
- John Murphy's Market Message
- MurphyExplainsMarketAnalysis-Intermarket Analysis
- MurphyExplainsMarketAnalysis-Visual Analysis
- StockCharts.com
- Technical Analysis of the Financial Markets
- The Visual Investor
- VectorVest, Inc.
- Executive Premier Workshop
- One-Day Options Course
- OptionsPro
- Retirement Income Workshop
- Sure-Fire Trading Systems (VectorVest, Inc.)
- Trading as a Business Workshop
- VectorVest 7 EOD
- VectorVest 7 RealTime/IntraDay
- VectorVest AutoTester
- VectorVest Educational Services
- VectorVest OnLine
- VectorVest Options Analyzer
- VectorVest ProGraphics v6.0
- VectorVest ProTrader 7
- VectorVest RealTime Derby Tool
- VectorVest Simulator
- VectorVest Variator
- VectorVest Watchdog
