

HOT TOPICS LIST
- MACD
- Fibonacci
- RSI
- Gann
- ADXR
- Stochastics
- Volume
- Triangles
- Futures
- Cycles
- Volatility
- ZIGZAG
- MESA
- Retracement
- Aroon
INDICATORS LIST
LIST OF TOPICS
PRINT THIS ARTICLE
by Han Kim
Here's a candlestick pattern that can signal a reversal.
Position: Sell
Han Kim
Traders.com Advantage Staff Writer
PRINT THIS ARTICLE
CANDLESTICK CHARTING
Far East Flavor Part 2 - Engulfing Patterns
06/05/00 12:17:03 PMby Han Kim
Here's a candlestick pattern that can signal a reversal.
Position: Sell
| The engulfing pattern, so-called because of the illusion of a larger candlestick overshadowing or engulfing the candlestick before it, alerts you to the possibility of a trend reversal. While it's fairly easy to find engulfing patterns on candlestick charts, the pattern is only significant during a trending market. For example, a bearish engulfing pattern can form during an uptrend when the following conditions are met: 1. Two consecutive candlesticks are required. 2. The range of the first candlestick's body must fall completely within the range of the second candlestick's body, (but doesn't have to engulf the shadows), making the second candlestick larger and starting and ending above and below the body of the first candlestick. 3. The second candlestick must be negative with a dark-colored body. The color of the first candlestick should be the opposite of the second, or it can have a neglible body size with no discernable color. In a downtrend the opposite will happen and a bullish engulfing pattern will form when the body of the second candlestick is positive, and engulfs the smaller, negatively-colored first candlestick. |
| Theoretically, an engulfing pattern indicates that one side of the supply/demand is being overwhelmed by the other at the price level. In an uptrend, the supply suddenly overwhelms demand and the price drops, and in a downtrend the demand becomes higher than supply and the price rises. |
|
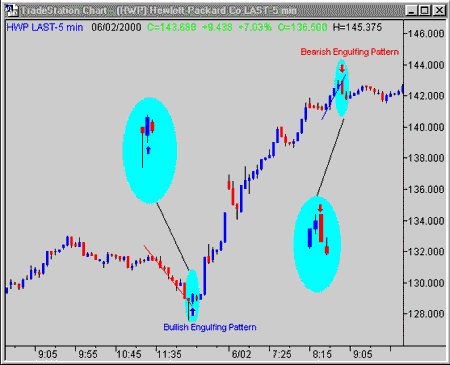
| This 5-minute intraday candlestick chart of Hewlett-Packard Co. [HWP] shows both bullish and bearish engulfing patterns. |
| Graphic provided by: TradeStation. |
| |
| The above chart of Hewlett-Packard Co. [HWP] shows an example of both engulfing patterns. Near the end of the trading day on June 1, 2000, a bullish engulfing pattern formed after a downtrend. An uptrend developed after the engulfing pattern. Then on June 2, a bearish engulfing pattern formed, which may signal that the end of the current uptrend may be close. |
Traders.com Advantage Staff Writer
| Title: | Webmaster |
| Company: | Technical Analysis, Inc. |
| Address: | 4757 California AVE SW |
| Seattle, WA 98116 | |
| Phone # for sales: | 206-938-0570 |
| Fax: | 206-938-1307 |
| Website: | www.traders.com |
| E-mail address: | hkim@traders.com |
Traders' Resource Links | |
| Charting the Stock Market: The Wyckoff Method -- Books | |
| Working-Money.com -- Online Trading Services | |
| Traders.com Advantage -- Online Trading Services | |
| Technical Analysis of Stocks & Commodities -- Publications and Newsletters | |
| Working Money, at Working-Money.com -- Publications and Newsletters | |
| Traders.com Advantage -- Publications and Newsletters | |
| Professional Traders Starter Kit -- Software | |
Click here for more information about our publications!
Comments
Date:�/ /Rank:�5Comment:�

Request Information From Our Sponsors
- StockCharts.com, Inc.
- Candle Patterns
- Candlestick Charting Explained
- Intermarket Technical Analysis
- John Murphy on Chart Analysis
- John Murphy's Chart Pattern Recognition
- John Murphy's Market Message
- MurphyExplainsMarketAnalysis-Intermarket Analysis
- MurphyExplainsMarketAnalysis-Visual Analysis
- StockCharts.com
- Technical Analysis of the Financial Markets
- The Visual Investor
- VectorVest, Inc.
- Executive Premier Workshop
- One-Day Options Course
- OptionsPro
- Retirement Income Workshop
- Sure-Fire Trading Systems (VectorVest, Inc.)
- Trading as a Business Workshop
- VectorVest 7 EOD
- VectorVest 7 RealTime/IntraDay
- VectorVest AutoTester
- VectorVest Educational Services
- VectorVest OnLine
- VectorVest Options Analyzer
- VectorVest ProGraphics v6.0
- VectorVest ProTrader 7
- VectorVest RealTime Derby Tool
- VectorVest Simulator
- VectorVest Variator
- VectorVest Watchdog