HOT TOPICS LIST
- MACD
- Fibonacci
- RSI
- Gann
- ADXR
- Stochastics
- Volume
- Triangles
- Futures
- Cycles
- Volatility
- ZIGZAG
- MESA
- Retracement
- Aroon
INDICATORS LIST
LIST OF TOPICS
PRINT THIS ARTICLE
by Gary Grosschadl
Two weeks ago, Costco warned of a top. Now there is clear confirmation.
Position: Sell
Gary Grosschadl
Independent Canadian equities trader and technical analyst based in Peterborough
Ontario, Canada.
PRINT THIS ARTICLE
CHART ANALYSIS
Costco Coming Down
11/22/04 08:58:00 AMby Gary Grosschadl
Two weeks ago, Costco warned of a top. Now there is clear confirmation.
Position: Sell
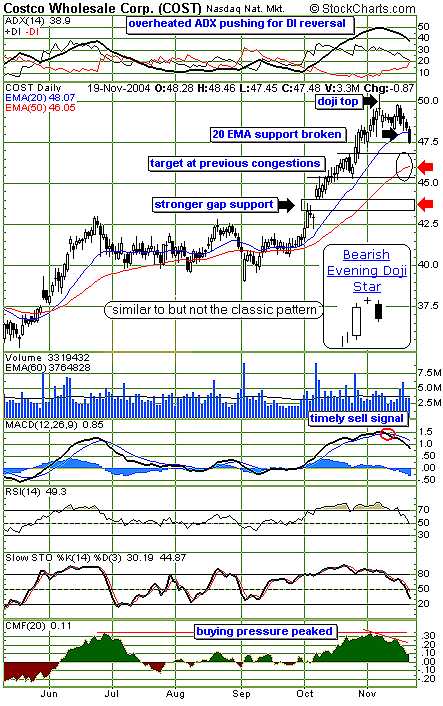
| One of the more reliable candlestick patterns involve doji tops and bottoms. I always take heed of any doji candlestick after periods of significant uptrends or downtrends. The doji with its same opening and closing price signals a probable change in momentum with an apparent stalement between bulls and bears during that session. Dojis often mark significant tops and bottoms. |
| Friday's trading session provided the strongest confirmation thus far for the likely doji top. The 20-day exponential moving average (EMA) was broken to the downside for the first time since this upleg began in October. This can lead to a bigger downleg. |

|
| Figure 1: Costco may have reached a significant top on this daily chart. |
| Graphic provided by: StockCharts.com. |
| |
| Other earlier bearish confirmations can also be seen via volume and other indicators. The average directional movement index (ADX) at the top of the chart shows a reversal from overheated conditions as it reverses from a peak. This indicates a possible change in trend, especially when the directional index (DI) converges toward a bearish cross (just at the verge here). The trading volume also gave reason for concern. Lower volume at new highs reflect less conviction by the bulls that the advance is sustainable. The moving average convergence/divergence (MACD) provided a timely sell signal, with its bearish crossover leading to declines in the next two indicators (the relative strength index [RSI] and stochastics). Finally at the bottom of the chart, the Chaikin money flow indicator (MFI) shows a peak in buying pressure, which did not manage to surpass the previous peak at much lower stock price levels. |
| I have indicated two downside targets, the higher being the previous congestion zone between $45-47; note the 50-day exponential moving average (EMA) is near $46. A bounce there should not be ruled out, as the stock could try to reload for another go at the top. If this congestion zone does not hold, there is stronger support shown at the gap area of $44. |
| Looking ahead, another consideration comes to mind. If the doji top does point at a significant trend change, the stock could go into what I call "failure mode." This is described as the stock not being able to close above its overhead 20-day EMA. This moving average becomes a failure line as bear rallies are stopped there and the stock trends downward. A close above this 20-period EMA may give the upper hand back to bullish forces, but until this happens, I remain bearish on Costco. |
Independent Canadian equities trader and technical analyst based in Peterborough
Ontario, Canada.
| Website: | www.whatsonsale.ca/financial.html |
| E-mail address: | gwg7@sympatico.ca |
Click here for more information about our publications!
Comments
Date: 11/22/04Rank: 5Comment:

|

Request Information From Our Sponsors
- VectorVest, Inc.
- Executive Premier Workshop
- One-Day Options Course
- OptionsPro
- Retirement Income Workshop
- Sure-Fire Trading Systems (VectorVest, Inc.)
- Trading as a Business Workshop
- VectorVest 7 EOD
- VectorVest 7 RealTime/IntraDay
- VectorVest AutoTester
- VectorVest Educational Services
- VectorVest OnLine
- VectorVest Options Analyzer
- VectorVest ProGraphics v6.0
- VectorVest ProTrader 7
- VectorVest RealTime Derby Tool
- VectorVest Simulator
- VectorVest Variator
- VectorVest Watchdog
- StockCharts.com, Inc.
- Candle Patterns
- Candlestick Charting Explained
- Intermarket Technical Analysis
- John Murphy on Chart Analysis
- John Murphy's Chart Pattern Recognition
- John Murphy's Market Message
- MurphyExplainsMarketAnalysis-Intermarket Analysis
- MurphyExplainsMarketAnalysis-Visual Analysis
- StockCharts.com
- Technical Analysis of the Financial Markets
- The Visual Investor
