

HOT TOPICS LIST
- MACD
- Fibonacci
- RSI
- Gann
- ADXR
- Stochastics
- Volume
- Triangles
- Futures
- Cycles
- Volatility
- ZIGZAG
- MESA
- Retracement
- Aroon
INDICATORS LIST
LIST OF TOPICS
PRINT THIS ARTICLE
by David Penn
Who knew more about Sears' "hidden value," Eddie Lampert or the positive divergence in the 7,10 stochastic?
Position: N/A
David Penn
Technical Writer for Technical Analysis of STOCKS & COMMODITIES magazine, Working-Money.com, and Traders.com Advantage.
PRINT THIS ARTICLE
DOUBLE BOTTOMS
Stochastics Size Up Sears For Sale
11/19/04 09:23:05 AMby David Penn
Who knew more about Sears' "hidden value," Eddie Lampert or the positive divergence in the 7,10 stochastic?
Position: N/A
| Having had some recent success in combining indicators and chart patterns (see my "Big MO's Double Bottom: 2B Or Not 2B?", September 30, 2004; Traders.com Advantage, and "Big MO's 2B Double Bottom Revisited," November 17, 2004; Traders.com Advantage), I've continued to look for instances in which some of my favorite setups have combined to provide telling suggestions of possible future price movement. |
| One example spotted admittedly after the fact was Sears (S). Sears has been in the headlines of late after news first broke that it would be purchased by Kmart. In the age of Wal-Mart, Home Depot, and Target ( to say nothing of Amazon.com and ebay.com), a Sears/Kmart combination would seem massively underwhelming. Nevertheless, financial wunderkind Eddie Lampert, who now controls Kmart, has won the admiration of the financial press (if not the financial industry; there is allegedly a growing short trade against Kmart), and many can barely contain their wonder at just what Lampert will do with the hidden value he believes can be unlocked in Sears. |
|
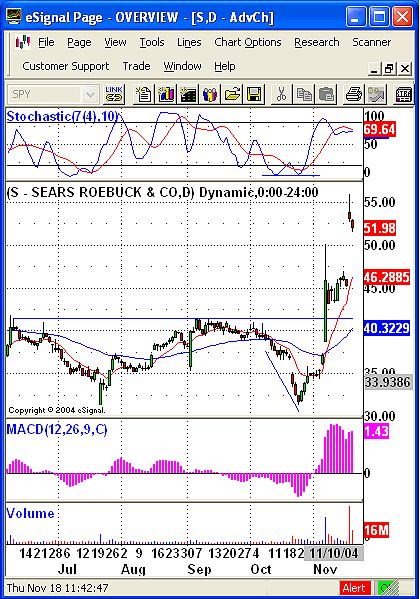
| Figure 1: Sears. The breakout from this double bottom in shares of Sears is anticipated in large part by the positive divergence that developed in October between prices and the 7,10 stochastic indicator. |
| Graphic provided by: eSignal. |
| |
| Technical analysis has a version of "hidden value" as well, and the action of the stochastic oscillator as shares of Sears moved lower and lower in October is an excellent example of this. Note first how successively higher price peaks in August and September were matched by successively lower stochastic peaks. This is an example of a negative divergence, which suggests that prices are headed lower. This suggestion was borne out initially by the stock's inability to move higher in September and subsequently by the stock's fade in October. |
| What traders and investors were confronted with in late October, however, was precisely the opposite application of stochastic divergences. Here, significantly lower lows in the price of Sears' stock were matched by consecutively higher lows in the 7,10 stochastic. I found this higher low a bit difficult to call on some charting packages, but in eSignal's package -- which gives specific indicator values -- a stochastic trough low on October 14 at 7.37 was followed by a stochastic trough low of 7.94 on October 25. Given that Sears was testing the lows from July 2004 and looked to be setting up a double bottom, this kind of positive stochastic divergence was worth paying attention to. |
| The double bottom in Sears anticipated a rally to approximately the 51 level. This target is derived by taking the size of the double bottom (the low of the double bottom came in mid-July near 31 and the high of the formation was near 41 in early September) and adding it to the value at the point of the breakout. The breakout/big volume day saw prices make an intraday high near 50, before sagging back into the close at 45.88. Since then, shares of Sears have managed to push higher -- first in a upwardly tilted consolidation in the first half of November, then in a powerful gap up on the news of Sears' purchase by Kmart. |
Technical Writer for Technical Analysis of STOCKS & COMMODITIES magazine, Working-Money.com, and Traders.com Advantage.
| Title: | Technical Writer |
| Company: | Technical Analysis, Inc. |
| Address: | 4757 California Avenue SW |
| Seattle, WA 98116 | |
| Phone # for sales: | 206 938 0570 |
| Fax: | 206 938 1307 |
| Website: | www.Traders.com |
| E-mail address: | DPenn@traders.com |
Traders' Resource Links | |
| Charting the Stock Market: The Wyckoff Method -- Books | |
| Working-Money.com -- Online Trading Services | |
| Traders.com Advantage -- Online Trading Services | |
| Technical Analysis of Stocks & Commodities -- Publications and Newsletters | |
| Working Money, at Working-Money.com -- Publications and Newsletters | |
| Traders.com Advantage -- Publications and Newsletters | |
| Professional Traders Starter Kit -- Software | |
Click here for more information about our publications!
Comments
Date:�11/20/04Rank:�3Comment:�
Date:�11/23/04Rank:�3Comment:�Interesting, but David does not make very clear nor convincing the arithmetic additive sum of the values for the Stochastic added to the breakout value as a predictor. This requires an actual even if simple equation and arrows on the schematic which point to exactly the point of the claimed values. I do not see the values and cannot identify the additive sum points in order to arrive at.... what result?

Request Information From Our Sponsors
- VectorVest, Inc.
- Executive Premier Workshop
- One-Day Options Course
- OptionsPro
- Retirement Income Workshop
- Sure-Fire Trading Systems (VectorVest, Inc.)
- Trading as a Business Workshop
- VectorVest 7 EOD
- VectorVest 7 RealTime/IntraDay
- VectorVest AutoTester
- VectorVest Educational Services
- VectorVest OnLine
- VectorVest Options Analyzer
- VectorVest ProGraphics v6.0
- VectorVest ProTrader 7
- VectorVest RealTime Derby Tool
- VectorVest Simulator
- VectorVest Variator
- VectorVest Watchdog
- StockCharts.com, Inc.
- Candle Patterns
- Candlestick Charting Explained
- Intermarket Technical Analysis
- John Murphy on Chart Analysis
- John Murphy's Chart Pattern Recognition
- John Murphy's Market Message
- MurphyExplainsMarketAnalysis-Intermarket Analysis
- MurphyExplainsMarketAnalysis-Visual Analysis
- StockCharts.com
- Technical Analysis of the Financial Markets
- The Visual Investor