HOT TOPICS LIST
- MACD
- Fibonacci
- RSI
- Gann
- ADXR
- Stochastics
- Volume
- Triangles
- Futures
- Cycles
- Volatility
- ZIGZAG
- MESA
- Retracement
- Aroon
INDICATORS LIST
LIST OF TOPICS
PRINT THIS ARTICLE
by Arthur Hill
Despite strength in the precious metals group, Apex Silver (SIL) is lagging badly and the chart pattern points to further weakness.
Position: Sell
Arthur Hill
Arthur Hill is currently editor of TDTrader.com, a website specializing in trading strategies, sector/industry specific breadth stats and overall technical analysis. He passed the Society of Technical Analysts (STA London) diploma exam with distinction is a Certified Financial Technician (CFTe). Prior to TD Trader, he was the Chief Technical Analyst for Stockcharts.com and the main contributor to the ChartSchool.
PRINT THIS ARTICLE
ACCUM./DIST. CHAIKIN
Apex Silver Lagging
11/18/04 08:40:09 AMby Arthur Hill
Despite strength in the precious metals group, Apex Silver (SIL) is lagging badly and the chart pattern points to further weakness.
Position: Sell
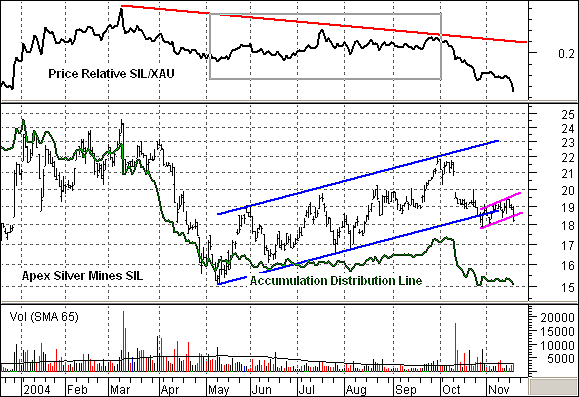
| Relative to the Philadelphia Gold & Silver Index ($XAU), SIL has been underperforming since March. The price relative shows the SIL/XAU ratio. The ratio rises when SIL outperforms and falls when SIL underperforms. The ratio held up fairly well from March to September, but started to fall again in October and November. The ratio is now hitting new lows and Apex is likely to follow. |
| The accumulation-distribution line has been overlaid on the price chart, and it confirms selling pressure. In addition, a look at volume shows that there are more red bars (down days) above the 65-day average than green bars (up days). Volume is increasing on the downside and this shows blatant selling pressure. These volume patterns have driven the accumulation-distribution line to new lows and the stock is likely to follow suit. |

|
| Figure 1: Apex Silver Mines |
| Graphic provided by: MetaStock. |
| Graphic provided by: Reuters Data. |
| |
| The price chart confirms these bearish indicators. First, the stock gapped down in October and this gap has yet to be filled, which makes it a breakaway gap. Filling this gap would be the first step to getting the bull on track. Second, the stock broke the lower trendline of a rising price channel. The lower trendline defined the upward trajectory and it is now broken. Third, the stock formed a rising flag over the last few weeks (magenta lines). A break appears to be in progress, and this will target further weakness toward the May low around 15. |
Arthur Hill is currently editor of TDTrader.com, a website specializing in trading strategies, sector/industry specific breadth stats and overall technical analysis. He passed the Society of Technical Analysts (STA London) diploma exam with distinction is a Certified Financial Technician (CFTe). Prior to TD Trader, he was the Chief Technical Analyst for Stockcharts.com and the main contributor to the ChartSchool.
| Title: | Editor |
| Company: | TDTrader.com |
| Address: | Willem Geetsstraat 17 |
| Mechelen, B2800 | |
| Phone # for sales: | 3215345465 |
| Website: | www.tdtrader.com |
| E-mail address: | arthurh@tdtrader.com |
Traders' Resource Links | |
| TDTrader.com has not added any product or service information to TRADERS' RESOURCE. | |
Click here for more information about our publications!
Comments
Date: 11/18/04Rank: 3Comment:

Request Information From Our Sponsors
- StockCharts.com, Inc.
- Candle Patterns
- Candlestick Charting Explained
- Intermarket Technical Analysis
- John Murphy on Chart Analysis
- John Murphy's Chart Pattern Recognition
- John Murphy's Market Message
- MurphyExplainsMarketAnalysis-Intermarket Analysis
- MurphyExplainsMarketAnalysis-Visual Analysis
- StockCharts.com
- Technical Analysis of the Financial Markets
- The Visual Investor
- VectorVest, Inc.
- Executive Premier Workshop
- One-Day Options Course
- OptionsPro
- Retirement Income Workshop
- Sure-Fire Trading Systems (VectorVest, Inc.)
- Trading as a Business Workshop
- VectorVest 7 EOD
- VectorVest 7 RealTime/IntraDay
- VectorVest AutoTester
- VectorVest Educational Services
- VectorVest OnLine
- VectorVest Options Analyzer
- VectorVest ProGraphics v6.0
- VectorVest ProTrader 7
- VectorVest RealTime Derby Tool
- VectorVest Simulator
- VectorVest Variator
- VectorVest Watchdog
