HOT TOPICS LIST
- MACD
- Fibonacci
- RSI
- Gann
- ADXR
- Stochastics
- Volume
- Triangles
- Futures
- Cycles
- Volatility
- ZIGZAG
- MESA
- Retracement
- Aroon
INDICATORS LIST
LIST OF TOPICS
PRINT THIS ARTICLE
by Chris Manuell
Home Depot encountered some aggressive profit-taking -- in line with other retailers -- to complete a bearish engulfing pattern on the daily chart.
Position: N/A
Chris Manuell
Chris Manuell spent 7 years as a futures sales/trader for a large investment bank and more recently as a technical analyst for an independent research company. He has a bachelor of economics and graduate diploma in applied finance & investment. Currently enrolled in the CMT program with the MTA.
PRINT THIS ARTICLE
CANDLESTICK CHARTING
Home Depot Bearish Engulfing
11/17/04 03:46:18 PMby Chris Manuell
Home Depot encountered some aggressive profit-taking -- in line with other retailers -- to complete a bearish engulfing pattern on the daily chart.
Position: N/A
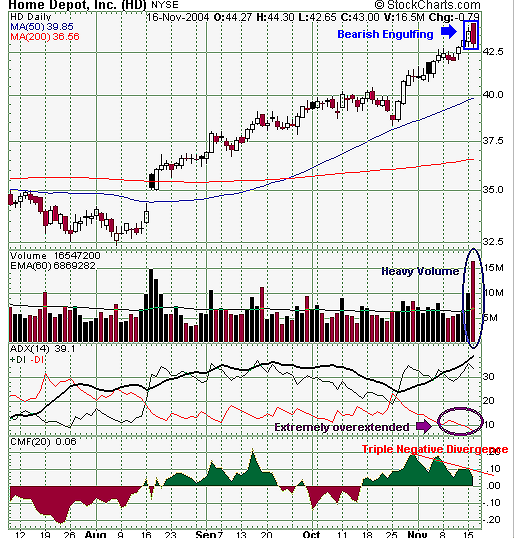
| Home Depot has enjoyed a sharp rally since breaking out of a large congestion pattern in early September. The market completed a bearish engulfing pattern on the daily charts on November 16, which may stall the rally in the near term. A bearish engulfing pattern is a reversal pattern that demonstrates a swing in sentiment as the bears attempt to overwhelm the bulls. The body of the dark second candle envelopes the body of the previous white candle. Home Depot's bearish engulfing pattern was completed with another candlestick pattern -- the bearish belt hold -- signified by a long dark candle that opens on its high and trades lower to close near or on it low. This heightened the bearish statement of the bearish engulfing pattern and could result in a minor high being put in place in the near term. The high of the bearish engulfing/bearish belt hold at 44.30 should now act as an important resistance level. |
| Home Depot's engulfing pattern was given more credibility by the heavy volume exhibited during the session, reflecting the enthusiasm of sellers and validates the pattern. The probability of the bearish engulfing pattern working is also improved when the market has undergone a sharp move -- the negative directional movement indicator made up in the DMI has reached a three-year low -- highlighting the velocity of the move. |

|
| Figure 1: Daily Chart Home Depot |
| Graphic provided by: StockCharts.com. |
| |
| The Chaikin money flow is based on the principle that rising prices should be accompanied by expanding volume, and recently, this indicator has completed a triple negative divergence. This negative divergence can often result in a change of trend and supports the weakness displayed by the bearish engulfing pattern. |
| In summary, Home Depot's rally should stall in the near term as participants "take some chips off the table," which could provide the investor with an opportunity to enter the bullish intermediate trend at more favorable levels. |
Chris Manuell spent 7 years as a futures sales/trader for a large investment bank and more recently as a technical analyst for an independent research company. He has a bachelor of economics and graduate diploma in applied finance & investment. Currently enrolled in the CMT program with the MTA.
| E-mail address: | chrismanuell5@yahoo.co.uk |
Click here for more information about our publications!
Comments
Date: 11/17/04Rank: 3Comment:

|

Request Information From Our Sponsors
- StockCharts.com, Inc.
- Candle Patterns
- Candlestick Charting Explained
- Intermarket Technical Analysis
- John Murphy on Chart Analysis
- John Murphy's Chart Pattern Recognition
- John Murphy's Market Message
- MurphyExplainsMarketAnalysis-Intermarket Analysis
- MurphyExplainsMarketAnalysis-Visual Analysis
- StockCharts.com
- Technical Analysis of the Financial Markets
- The Visual Investor
- VectorVest, Inc.
- Executive Premier Workshop
- One-Day Options Course
- OptionsPro
- Retirement Income Workshop
- Sure-Fire Trading Systems (VectorVest, Inc.)
- Trading as a Business Workshop
- VectorVest 7 EOD
- VectorVest 7 RealTime/IntraDay
- VectorVest AutoTester
- VectorVest Educational Services
- VectorVest OnLine
- VectorVest Options Analyzer
- VectorVest ProGraphics v6.0
- VectorVest ProTrader 7
- VectorVest RealTime Derby Tool
- VectorVest Simulator
- VectorVest Variator
- VectorVest Watchdog
