HOT TOPICS LIST
- MACD
- Fibonacci
- RSI
- Gann
- ADXR
- Stochastics
- Volume
- Triangles
- Futures
- Cycles
- Volatility
- ZIGZAG
- MESA
- Retracement
- Aroon
INDICATORS LIST
LIST OF TOPICS
PRINT THIS ARTICLE
by David Penn
Nearly 10 points higher from our last look at Altria Group, the stock formerly known as Philip Morris moves into a triangular consolidation and threatens to move higher.
Position: N/A
David Penn
Technical Writer for Technical Analysis of STOCKS & COMMODITIES magazine, Working-Money.com, and Traders.com Advantage.
PRINT THIS ARTICLE
DOUBLE BOTTOMS
Big MO's 2B Double Bottom Revisited
11/17/04 08:26:16 AMby David Penn
Nearly 10 points higher from our last look at Altria Group, the stock formerly known as Philip Morris moves into a triangular consolidation and threatens to move higher.
Position: N/A
| Back in the last days of September, with the market well into a rally that began with the mid-August lows, I suggested that Altria Group nee Philip Morris was likely to join in the bullish business -- albeit perhaps belatedly ("Big MO's Double Bottom: 2B Or Not 2B?" September 30, 2004, Traders.com Advantage). |
| The tools for that analysis were the 2B test of bottom, introduced by Victor Sperandeo (METHODS OF A WALL STREET MASTER) or, if you prefer, Larry Connors' Turtle Soup test from his book, STREET SMARTS. An additional analytic tool was the notion of a double bottom based on the twin troughs of May 2004 and September 2004. In the article I mentioned previously, I noted that this was one of the better double bottoms I've come across because of the clear separation between the two troughs. |

|
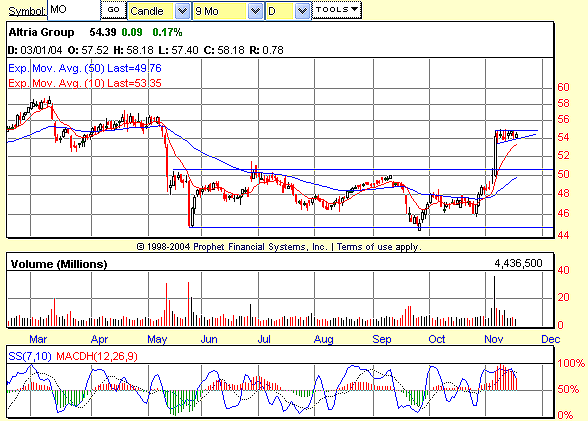
| Figure 1: Altria Group. A powerful one-day breakout from this six-month double bottom propels shares of Altria toward a minimum upside target of 57. Note the overwhelming volume on the breakout. |
| Graphic provided by: Prophet Financial, Inc. |
| |
| However much I expected prices to rally, I won't pretend for a second that I saw that nearly five-point-day on November 4. Perhaps Altria Group investors were as worried about a John Kerry victory in the US Presidential race as pharmaceuticals investors. ... |
| Where does that powerful breakout leave us now? After the breakout, MO began moving in a largely sideways consolidation range for the next six or seven trading days. Even if the consolidation range didn't have a slight upward bias -- courtesy of the upwardly sloping support trendline and the relatively horizontal resistance trendline, a courtesy also known as an ascending triangle -- the fact of the matter is that consolidations that develop at the end of powerful rallies tend to anticipate further advances. |
| In and of itself, the diminutive size of the consolidation doesn't promise a great deal in the way of price movement (at its widest, the consolidation is only a point and a half). However, it is worth remembering that the breakout target for the double bottom was 57. And with a recent close near 54 and a half, a new breakout and push higher from even a pint-sized ascending triangle might be all that Altria's double bottom ordered. |
Technical Writer for Technical Analysis of STOCKS & COMMODITIES magazine, Working-Money.com, and Traders.com Advantage.
| Title: | Technical Writer |
| Company: | Technical Analysis, Inc. |
| Address: | 4757 California Avenue SW |
| Seattle, WA 98116 | |
| Phone # for sales: | 206 938 0570 |
| Fax: | 206 938 1307 |
| Website: | www.Traders.com |
| E-mail address: | DPenn@traders.com |
Traders' Resource Links | |
| Charting the Stock Market: The Wyckoff Method -- Books | |
| Working-Money.com -- Online Trading Services | |
| Traders.com Advantage -- Online Trading Services | |
| Technical Analysis of Stocks & Commodities -- Publications and Newsletters | |
| Working Money, at Working-Money.com -- Publications and Newsletters | |
| Traders.com Advantage -- Publications and Newsletters | |
| Professional Traders Starter Kit -- Software | |
Click here for more information about our publications!
Comments
Date: 11/17/04Rank: 3Comment:

Request Information From Our Sponsors
- VectorVest, Inc.
- Executive Premier Workshop
- One-Day Options Course
- OptionsPro
- Retirement Income Workshop
- Sure-Fire Trading Systems (VectorVest, Inc.)
- Trading as a Business Workshop
- VectorVest 7 EOD
- VectorVest 7 RealTime/IntraDay
- VectorVest AutoTester
- VectorVest Educational Services
- VectorVest OnLine
- VectorVest Options Analyzer
- VectorVest ProGraphics v6.0
- VectorVest ProTrader 7
- VectorVest RealTime Derby Tool
- VectorVest Simulator
- VectorVest Variator
- VectorVest Watchdog
- StockCharts.com, Inc.
- Candle Patterns
- Candlestick Charting Explained
- Intermarket Technical Analysis
- John Murphy on Chart Analysis
- John Murphy's Chart Pattern Recognition
- John Murphy's Market Message
- MurphyExplainsMarketAnalysis-Intermarket Analysis
- MurphyExplainsMarketAnalysis-Visual Analysis
- StockCharts.com
- Technical Analysis of the Financial Markets
- The Visual Investor
