HOT TOPICS LIST
- MACD
- Fibonacci
- RSI
- Gann
- ADXR
- Stochastics
- Volume
- Triangles
- Futures
- Cycles
- Volatility
- ZIGZAG
- MESA
- Retracement
- Aroon
INDICATORS LIST
LIST OF TOPICS
PRINT THIS ARTICLE
by David Penn
A summer triangle consolidation provided a floor for unhedged gold company shares. Now a smaller autumn triangle sets up a test of the ceiling.
Position: N/A
David Penn
Technical Writer for Technical Analysis of STOCKS & COMMODITIES magazine, Working-Money.com, and Traders.com Advantage.
PRINT THIS ARTICLE
TRIANGLES
Triangles Take The $HUI Higher
11/17/04 08:21:00 AMby David Penn
A summer triangle consolidation provided a floor for unhedged gold company shares. Now a smaller autumn triangle sets up a test of the ceiling.
Position: N/A
| I've written about my love affair with triangular chart patterns (most recently in my "Trading An Intraday Triangle," Traders.com Advantage, November 8, 2004). Watching gold futures move to new highs in recent days has me looking also at gold stocks -- the primary vehicle for the average trader or investors looking for exposure to the gold price. And in looking at gold stocks, I find myself looking once again at triangles. |
| As I wrote in that piece, there is a simplicity to triangles that is quite compelling. Moreso than head and shoulders formations, or double tops and bottoms, triangles suggest one thing: decreasing volatility. And in the possibility that that decrease in volatility will prove short-lived, that volatility will revert to a mean that is higher than what is suggested by the triangle consolidation, lies the possibility of significant profits for the trader or investor. |

|
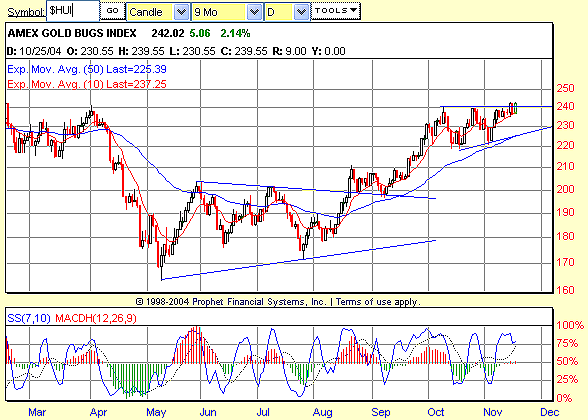
| Figure 1: Amex Gold Bugs Index. The summer triangle projected a minimum upside to the 235 level. An autumn triangle suggests a minimum move to 260. |
| Graphic provided by: Prophet Financial, Inc. |
| |
| The simplicity of triangles is no less helpful when they don't work. If prices travel too far down the length of a triangle -- or if the triangle boundaries are penetrated, only to have the breakout fall back into the pattern and resume a sideways movement (turning the triangle into a rectangle) -- then a trader or investor usually can spot this development clearly and rule out any pattern-specific strategy based on the expectation of a breakout from a triangle. |
| In the case of the $HUI, there were two noteworthy triangles. The first was a large and rather sloppy symmetrical triangle that began in mid-May and ended with a mid-August breakout, an early September test of that breakout, and a strong move higher over the balance of the month. By "symmetrical," I don't mean that the slope of the converging trendlines is equal, but merely that the trendlines bounding the triangle are in fact converging. This is for me a more widely applicable definition of a symmetrical triangle -- and still serves to distinguish these generally nondirectional triangles from their more directional brethren (that is, ascending and descending triangles). |
| The second triangle is the present one, which looks very much like an ascending triangle. When I called ascending triangles "directional," I meant that successful ascending triangles produce upside breakouts (conversely, successful descending triangles produce downside breakdowns). As such, the current consolidation range has a bias to the upside and a breakout -- rather than a breakdown -- is what traders and investors in gold stocks should be most alert for. Measuring the triangle at its widest point (approximately 20 points) and adding that value to the value at the price breakout (horizontal resistance is at approximately 240) suggests that if this ascending triangle is successful, it will produce an upside move to the 260 area. At 260, the $HUI would exceed not only its year-to-date highs, but would also mark the highest point reached by the $HUI in several years. |
Technical Writer for Technical Analysis of STOCKS & COMMODITIES magazine, Working-Money.com, and Traders.com Advantage.
| Title: | Technical Writer |
| Company: | Technical Analysis, Inc. |
| Address: | 4757 California Avenue SW |
| Seattle, WA 98116 | |
| Phone # for sales: | 206 938 0570 |
| Fax: | 206 938 1307 |
| Website: | www.Traders.com |
| E-mail address: | DPenn@traders.com |
Traders' Resource Links | |
| Charting the Stock Market: The Wyckoff Method -- Books | |
| Working-Money.com -- Online Trading Services | |
| Traders.com Advantage -- Online Trading Services | |
| Technical Analysis of Stocks & Commodities -- Publications and Newsletters | |
| Working Money, at Working-Money.com -- Publications and Newsletters | |
| Traders.com Advantage -- Publications and Newsletters | |
| Professional Traders Starter Kit -- Software | |
Click here for more information about our publications!
Comments
Date: 11/17/04Rank: 3Comment:

|

Request Information From Our Sponsors
- StockCharts.com, Inc.
- Candle Patterns
- Candlestick Charting Explained
- Intermarket Technical Analysis
- John Murphy on Chart Analysis
- John Murphy's Chart Pattern Recognition
- John Murphy's Market Message
- MurphyExplainsMarketAnalysis-Intermarket Analysis
- MurphyExplainsMarketAnalysis-Visual Analysis
- StockCharts.com
- Technical Analysis of the Financial Markets
- The Visual Investor
- VectorVest, Inc.
- Executive Premier Workshop
- One-Day Options Course
- OptionsPro
- Retirement Income Workshop
- Sure-Fire Trading Systems (VectorVest, Inc.)
- Trading as a Business Workshop
- VectorVest 7 EOD
- VectorVest 7 RealTime/IntraDay
- VectorVest AutoTester
- VectorVest Educational Services
- VectorVest OnLine
- VectorVest Options Analyzer
- VectorVest ProGraphics v6.0
- VectorVest ProTrader 7
- VectorVest RealTime Derby Tool
- VectorVest Simulator
- VectorVest Variator
- VectorVest Watchdog
