HOT TOPICS LIST
- MACD
- Fibonacci
- RSI
- Gann
- ADXR
- Stochastics
- Volume
- Triangles
- Futures
- Cycles
- Volatility
- ZIGZAG
- MESA
- Retracement
- Aroon
INDICATORS LIST
LIST OF TOPICS
PRINT THIS ARTICLE
by Arthur Hill
After a normal correction, Comcast shows signs of firming with a bullish reversal pattern taking shape.
Position: Buy
Arthur Hill
Arthur Hill is currently editor of TDTrader.com, a website specializing in trading strategies, sector/industry specific breadth stats and overall technical analysis. He passed the Society of Technical Analysts (STA London) diploma exam with distinction is a Certified Financial Technician (CFTe). Prior to TD Trader, he was the Chief Technical Analyst for Stockcharts.com and the main contributor to the ChartSchool.
PRINT THIS ARTICLE
HEAD & SHOULDERS
Comcast Firms With Bullish Reversal Pattern
11/16/04 07:51:31 AMby Arthur Hill
After a normal correction, Comcast shows signs of firming with a bullish reversal pattern taking shape.
Position: Buy
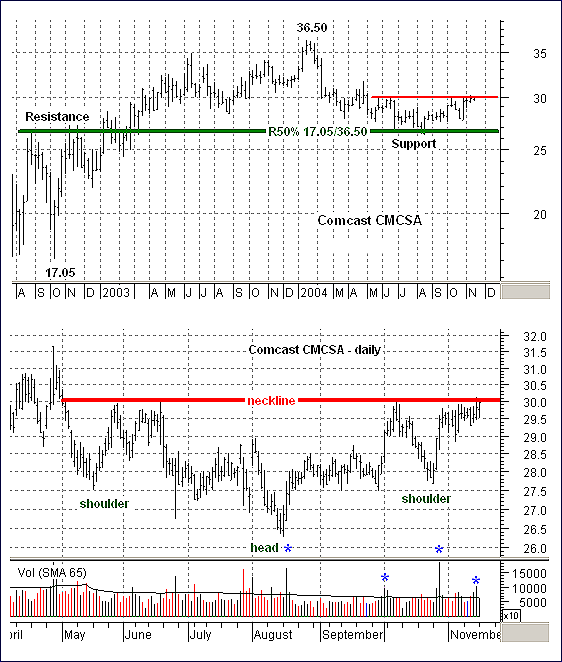
| Strong advances are typically followed by corrections that have certain characteristics. In the case of Comcast (CMCSA), the stock advanced sharply from 17.05 to 36.5 and then corrected back to around 26-27. This decline retraced half of the prior advance. Normal corrections retrace a third to two-thirds of the prior advance, and this fits right in the middle. |
| In addition to the normal retracement, the stock found support near broken resistance. The stock met resistance around 26-27 in August and November 2003. Once broken, this resistance line extends and becomes support, which was confirmed with two bounces in June and August 2004. A return to broken support is also typical for a correction. |

|
| Figure 1: Comcast |
| Graphic provided by: MetaStock. |
| Graphic provided by: Reuters Data. |
| |
| Since reaching support around 26-27, the stock consolidated and formed a head-and-shoulders pattern on the daily chart. This is a bullish reversal pattern that would be confirmed with a neckline breakout at 30. The left shoulder formed in May, the head in August, and the right shoulder in October. The downtrend was still in place with the August low, but the higher low of the right shoulder (October) shows buying interested and creates the potential for a reversal. |
| Recent volume patterns point to a breakout. Note that upside volume expanded during advances over the last three months (green asterisks). This shows strong buying pressure on each advance and increases the odds of a breakout. |
Arthur Hill is currently editor of TDTrader.com, a website specializing in trading strategies, sector/industry specific breadth stats and overall technical analysis. He passed the Society of Technical Analysts (STA London) diploma exam with distinction is a Certified Financial Technician (CFTe). Prior to TD Trader, he was the Chief Technical Analyst for Stockcharts.com and the main contributor to the ChartSchool.
| Title: | Editor |
| Company: | TDTrader.com |
| Address: | Willem Geetsstraat 17 |
| Mechelen, B2800 | |
| Phone # for sales: | 3215345465 |
| Website: | www.tdtrader.com |
| E-mail address: | arthurh@tdtrader.com |
Traders' Resource Links | |
| TDTrader.com has not added any product or service information to TRADERS' RESOURCE. | |
Click here for more information about our publications!
Comments
Date: 11/17/04Rank: 4Comment:

|

Request Information From Our Sponsors
- StockCharts.com, Inc.
- Candle Patterns
- Candlestick Charting Explained
- Intermarket Technical Analysis
- John Murphy on Chart Analysis
- John Murphy's Chart Pattern Recognition
- John Murphy's Market Message
- MurphyExplainsMarketAnalysis-Intermarket Analysis
- MurphyExplainsMarketAnalysis-Visual Analysis
- StockCharts.com
- Technical Analysis of the Financial Markets
- The Visual Investor
- VectorVest, Inc.
- Executive Premier Workshop
- One-Day Options Course
- OptionsPro
- Retirement Income Workshop
- Sure-Fire Trading Systems (VectorVest, Inc.)
- Trading as a Business Workshop
- VectorVest 7 EOD
- VectorVest 7 RealTime/IntraDay
- VectorVest AutoTester
- VectorVest Educational Services
- VectorVest OnLine
- VectorVest Options Analyzer
- VectorVest ProGraphics v6.0
- VectorVest ProTrader 7
- VectorVest RealTime Derby Tool
- VectorVest Simulator
- VectorVest Variator
- VectorVest Watchdog
