

HOT TOPICS LIST
- MACD
- Fibonacci
- RSI
- Gann
- ADXR
- Stochastics
- Volume
- Triangles
- Futures
- Cycles
- Volatility
- ZIGZAG
- MESA
- Retracement
- Aroon
INDICATORS LIST
LIST OF TOPICS
PRINT THIS ARTICLE
by Jayanthi Gopalakrishnan
Does the action in the Nasdaq Composite during the last few days indicate a trend reversal?
Position: N/A
Jayanthi Gopalakrishnan
PRINT THIS ARTICLE
SPEED LINES
Trend Reversal for the Nasdaq?
06/02/00 02:44:42 PMby Jayanthi Gopalakrishnan
Does the action in the Nasdaq Composite during the last few days indicate a trend reversal?
Position: N/A
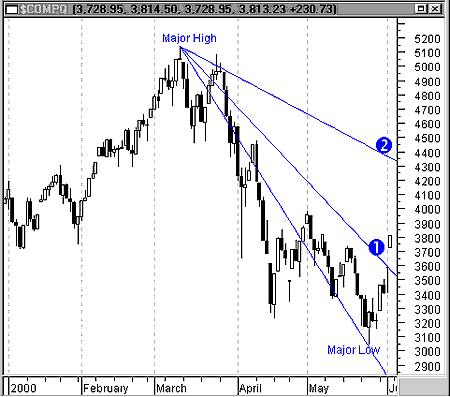
| Speed resistance lines are effective in determining support and resistance levels as well as whether a major trend is reversing or correcting. |
| Most technical analysis software includes the speed resistance line tool which will generate three speed resistance lines. The first connects the major high and low, then two other lines are generated at one-third and two-thirds the distance between the major high and low. |
|
| Speed resistance lines can be used to determine if a current trend is reversing or correcting. |
| Graphic provided by: MetaStock. |
| |
| The chart of the NASDAQ composite shows the speed resistance lines drawn from the major high to major low of the downward sloping trend. The point labeled 1 is the 2/3 line and the point labeled 2 is the 1/3 line. The 2/3 line is the first resistance point. If prices break out above this line for two consecutive days it is likely the trend will reverse. The 2/3 line will then become a support level. On 6/2/00 the Nasdaq gapped up and stayed well above the 2/3 line. If it had stayed below the 2/3 line, it would have indicated that the upward movement was just a short-term correction. |
| Today's upward gap in the Nasdaq seems to have restored bullish sentiment in the technology sector with several issues seeing sharp gains. If the index holds above the 2/3 line on the following trading day (6/5/00) the 1/3 line will be the next resistance level. |
| Title: | Editor |
| Company: | Technical Analysis of Stocks & Commodities |
| Address: | 4757 California Ave SW |
| Seattle, WA 98116 | |
| Website: | Traders.com |
| E-mail address: | Jayanthi@traders.com |
Traders' Resource Links | |
| Charting the Stock Market: The Wyckoff Method -- Books | |
| Working-Money.com -- Online Trading Services | |
| Traders.com Advantage -- Online Trading Services | |
| Technical Analysis of Stocks & Commodities -- Publications and Newsletters | |
| Working Money, at Working-Money.com -- Publications and Newsletters | |
| Traders.com Advantage -- Publications and Newsletters | |
| Professional Traders Starter Kit -- Software | |
Click here for more information about our publications!
Comments

Request Information From Our Sponsors
- VectorVest, Inc.
- Executive Premier Workshop
- One-Day Options Course
- OptionsPro
- Retirement Income Workshop
- Sure-Fire Trading Systems (VectorVest, Inc.)
- Trading as a Business Workshop
- VectorVest 7 EOD
- VectorVest 7 RealTime/IntraDay
- VectorVest AutoTester
- VectorVest Educational Services
- VectorVest OnLine
- VectorVest Options Analyzer
- VectorVest ProGraphics v6.0
- VectorVest ProTrader 7
- VectorVest RealTime Derby Tool
- VectorVest Simulator
- VectorVest Variator
- VectorVest Watchdog
- StockCharts.com, Inc.
- Candle Patterns
- Candlestick Charting Explained
- Intermarket Technical Analysis
- John Murphy on Chart Analysis
- John Murphy's Chart Pattern Recognition
- John Murphy's Market Message
- MurphyExplainsMarketAnalysis-Intermarket Analysis
- MurphyExplainsMarketAnalysis-Visual Analysis
- StockCharts.com
- Technical Analysis of the Financial Markets
- The Visual Investor