HOT TOPICS LIST
- MACD
- Fibonacci
- RSI
- Gann
- ADXR
- Stochastics
- Volume
- Triangles
- Futures
- Cycles
- Volatility
- ZIGZAG
- MESA
- Retracement
- Aroon
INDICATORS LIST
LIST OF TOPICS
PRINT THIS ARTICLE
by David Penn
Once again, the S&P 500's rally challenges a running negative stochastic divergence.
Position: N/A
David Penn
Technical Writer for Technical Analysis of STOCKS & COMMODITIES magazine, Working-Money.com, and Traders.com Advantage.
PRINT THIS ARTICLE
STOCHASTICS
Double Divergence
11/16/04 07:41:04 AMby David Penn
Once again, the S&P 500's rally challenges a running negative stochastic divergence.
Position: N/A
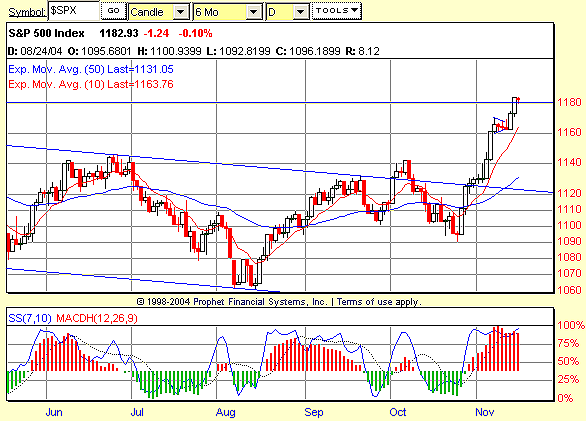
| Breaking out of a four-day pennant formation, the Standard & Poor's 500's rally continued higher last week. In some ways, "higher" is an understatement. The S&P 500's close above the 1177 level is a testament to the power of the rally that began in late October (see my article on "Divergences And The Bush Bounce," November 9, 2004, Traders.com Advantage). |
| The force of the rally -- which was widely anticipated in the mainstream financial media -- and the absence of any real selling pressure whatsoever has suggested to some market participants that this rally is driven as much by short-covering and long speculation as by anything else. But in the end, the "whys" don't matter nearly as much as the "whats." And the biggest "what" right now is: "What" comes next? |

|
| Figure 1: A month-to-month positive stochastic divergence sets up a bottom in late October. The downwardly sloping trendline represents resistance turned support, and extends from the January 2004 highs. The near-horizontal trendline above it represents the high from January 2002. |
| Graphic provided by: Prophet Financial, Inc. |
| |
| From a longer-term perspective, there is reason to believe that the S&P 500 could test all-time highs. As I discuss in an upcoming Working Money article ("Dow Theory Confirmations"), the primary bull market from the October 2002 lows may have ended in January 2004. But the bear market of 2004 never closed below the low of the last correction low in that primary bull market from October 2002 to January 2004. That "last correction low" took place in August 2003 near 960. This means that the bear market of 2004 might very well be a secondary reaction in a primary bull market that will continue after the secondary reaction runs its course (a course that would not be expected to allow the S&P 500 to fall below the August 2003 low I previously mentioned). As it turned out, the rally since late October 2004 is a strong argument that the secondary reaction is over. This was confirmed when the June 2004 highs were surpassed (the rally then having exceeded the previous bear market reaction -- or "bear market rally" high). But certainly the successful close above both the January 2004 and January 2002 highs only provided further confirmation. |
| So what are we to make of the running negative divergence between the S&P 500 and the 7,10 stochastic? Sure, when bull markets are at their most powerful, running negative divergences are almost to be expected for much of the time. But it was just such a running negative divergence that anticipated the market top in January 2004 (whether or not that top was the top of a primary bull market or merely the beginning of a significant secondary reaction). Even more impressive, this kind of stochastic divergence is also what anticipated the rally in late October 2004, as the Traders.com Advantage article I referred to earlier makes plain. |
| What is helpful in terms of monitoring the possibility of a reversal based on a negative stochastic divergence is that the stochastic will likely be more definitive sooner than price will. That is, as soon as the stochastic sets a new high, the possibility of a negative divergence based reversal is eliminated, providing the trader with clear warning signs that the odds are now antagonists. Whether trying to pick a top in this market or merely trying to maximize this trend's potential for further gains, traders will find it interesting to see how the S&P 500 resolves this date with the divergences. |
Technical Writer for Technical Analysis of STOCKS & COMMODITIES magazine, Working-Money.com, and Traders.com Advantage.
| Title: | Technical Writer |
| Company: | Technical Analysis, Inc. |
| Address: | 4757 California Avenue SW |
| Seattle, WA 98116 | |
| Phone # for sales: | 206 938 0570 |
| Fax: | 206 938 1307 |
| Website: | www.Traders.com |
| E-mail address: | DPenn@traders.com |
Traders' Resource Links | |
| Charting the Stock Market: The Wyckoff Method -- Books | |
| Working-Money.com -- Online Trading Services | |
| Traders.com Advantage -- Online Trading Services | |
| Technical Analysis of Stocks & Commodities -- Publications and Newsletters | |
| Working Money, at Working-Money.com -- Publications and Newsletters | |
| Traders.com Advantage -- Publications and Newsletters | |
| Professional Traders Starter Kit -- Software | |
Click here for more information about our publications!
Comments
Date: 11/17/04Rank: 4Comment:

|

Request Information From Our Sponsors
- StockCharts.com, Inc.
- Candle Patterns
- Candlestick Charting Explained
- Intermarket Technical Analysis
- John Murphy on Chart Analysis
- John Murphy's Chart Pattern Recognition
- John Murphy's Market Message
- MurphyExplainsMarketAnalysis-Intermarket Analysis
- MurphyExplainsMarketAnalysis-Visual Analysis
- StockCharts.com
- Technical Analysis of the Financial Markets
- The Visual Investor
- VectorVest, Inc.
- Executive Premier Workshop
- One-Day Options Course
- OptionsPro
- Retirement Income Workshop
- Sure-Fire Trading Systems (VectorVest, Inc.)
- Trading as a Business Workshop
- VectorVest 7 EOD
- VectorVest 7 RealTime/IntraDay
- VectorVest AutoTester
- VectorVest Educational Services
- VectorVest OnLine
- VectorVest Options Analyzer
- VectorVest ProGraphics v6.0
- VectorVest ProTrader 7
- VectorVest RealTime Derby Tool
- VectorVest Simulator
- VectorVest Variator
- VectorVest Watchdog
