HOT TOPICS LIST
- MACD
- Fibonacci
- RSI
- Gann
- ADXR
- Stochastics
- Volume
- Triangles
- Futures
- Cycles
- Volatility
- ZIGZAG
- MESA
- Retracement
- Aroon
INDICATORS LIST
LIST OF TOPICS
PRINT THIS ARTICLE
by Chris Manuell
Following the FOMC's recent decision to raise interest rates by 25 basis points, it appears that 10-year note yields are also set for a move up in the near term.
Position: N/A
Chris Manuell
Chris Manuell spent 7 years as a futures sales/trader for a large investment bank and more recently as a technical analyst for an independent research company. He has a bachelor of economics and graduate diploma in applied finance & investment. Currently enrolled in the CMT program with the MTA.
PRINT THIS ARTICLE
THE FALLING WEDGE
10-Year Note Falling Wedge
11/15/04 11:16:25 AMby Chris Manuell
Following the FOMC's recent decision to raise interest rates by 25 basis points, it appears that 10-year note yields are also set for a move up in the near term.
Position: N/A
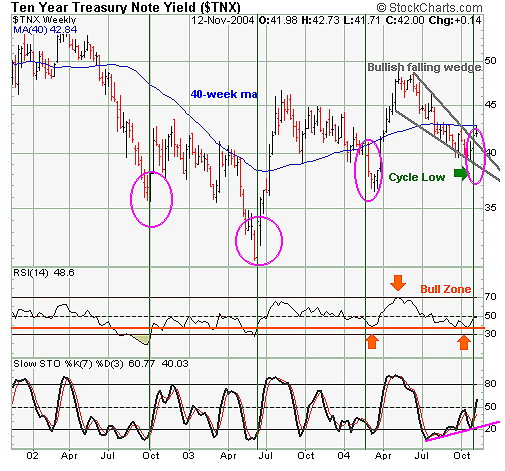
| The 10-year US Treasury note appears to have completed a bullish falling wedge on the weekly chart, characterized by two falling lines that are converging with the requisite touches on both trendlines. The falling wedge is symptomatic of a correction in a bullish market and often results in a sharp move to the beginning of the formation. Ten-year notes breached the upper boundary of the wedge on the week of November 8 and have a minimum objective for the June highs, which equates to 48.74 or 4.87 in yield terms. |
| The relative strength index (RSI) supports a move higher, with the oscillator recently completing a double bottom in the bull market zone of 35. This reinforces the difficulty that prices had, closing under the 40 level in September and October. Despite five forays beneath the 40 level over that time period, the 10-year note could only muster one close beneath 40, exemplifying a reluctance to move lower. The slow stochastics were also "price obnoxious," with their reluctance to follow price lower, triggering a triple bullish divergence, signifying underlying strength in the market. |

|
| Figure 1: Weekly 10-Year Treasury note yield |
| Graphic provided by: StockCharts.com. |
| |
| The 10-year note also appears to have entered a potential cycle low region with the equidistant points on the weekly chart corresponding with the previous three troughs. Given the supportive technical environment, the likelihood of another trough in the 10-year note is enhanced. |
Chris Manuell spent 7 years as a futures sales/trader for a large investment bank and more recently as a technical analyst for an independent research company. He has a bachelor of economics and graduate diploma in applied finance & investment. Currently enrolled in the CMT program with the MTA.
| E-mail address: | chrismanuell5@yahoo.co.uk |
Click here for more information about our publications!
Comments
Date: 11/15/04Rank: 3Comment:

Request Information From Our Sponsors
- StockCharts.com, Inc.
- Candle Patterns
- Candlestick Charting Explained
- Intermarket Technical Analysis
- John Murphy on Chart Analysis
- John Murphy's Chart Pattern Recognition
- John Murphy's Market Message
- MurphyExplainsMarketAnalysis-Intermarket Analysis
- MurphyExplainsMarketAnalysis-Visual Analysis
- StockCharts.com
- Technical Analysis of the Financial Markets
- The Visual Investor
- VectorVest, Inc.
- Executive Premier Workshop
- One-Day Options Course
- OptionsPro
- Retirement Income Workshop
- Sure-Fire Trading Systems (VectorVest, Inc.)
- Trading as a Business Workshop
- VectorVest 7 EOD
- VectorVest 7 RealTime/IntraDay
- VectorVest AutoTester
- VectorVest Educational Services
- VectorVest OnLine
- VectorVest Options Analyzer
- VectorVest ProGraphics v6.0
- VectorVest ProTrader 7
- VectorVest RealTime Derby Tool
- VectorVest Simulator
- VectorVest Variator
- VectorVest Watchdog
