HOT TOPICS LIST
- MACD
- Fibonacci
- RSI
- Gann
- ADXR
- Stochastics
- Volume
- Triangles
- Futures
- Cycles
- Volatility
- ZIGZAG
- MESA
- Retracement
- Aroon
INDICATORS LIST
LIST OF TOPICS
PRINT THIS ARTICLE
by David Penn
A Traders.com Advantage reader points to lumber's cyclical patterns and suggests higher prices ahead.
Position: N/A
David Penn
Technical Writer for Technical Analysis of STOCKS & COMMODITIES magazine, Working-Money.com, and Traders.com Advantage.
PRINT THIS ARTICLE
STOCHASTICS
Will Lumber Get A Lift?
11/12/04 09:12:41 AMby David Penn
A Traders.com Advantage reader points to lumber's cyclical patterns and suggests higher prices ahead.
Position: N/A
| One of the many satisfactions of this job is getting emails from readers who've spotted interesting technical developments in a stock, futures contract, or index that I've either overlooked or misinterpreted. Some of these readers have even gone on to become Traders.com Advantage contributors (hint, hint), enlarging the community of technical analysts that makes Traders.com Advantage one of the premier websites for independent, do-it-yourself technical analysis. |
| This past afternoon was an excellent case in point. A reader today sent me a brief email asking if I'd taken a look at lumber futures lately. I hadn't -- at least not since a July article ("Lumber in August," July 27, 2004) looking for a possible top over the summer. However, this reader -- who'd clearly been paying attention to lumber -- suggested that the current price action of lumber increasingly suggested that the commodity might move higher from current levels, in accordance with seasonal patterns. |

|
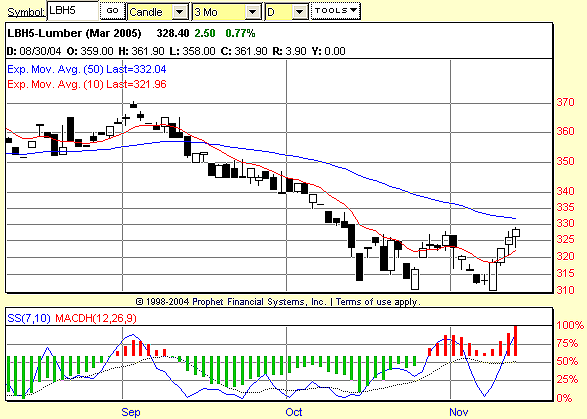
| Figure 1: Lumber and MACDH. The deep MACDH trough in September suggested that lower lumber prices were in the making, but a positive stochastic divergence between the mid-October and early November troughs suggests a bounce higher in the short term. |
| Graphic provided by: Prophet Financial, Inc. |
| |
| As I wrote months ago, I don't know much about lumber's seasonality or cyclicality (though I wondered aloud whether lumber tended to make significant price peaks every two to three years -- see "Lumber In August"). But the combination of a major moving average convergence/divergence histogram (MACDH) trough in September and October and a positive stochastic divergence argues for higher prices in the immediate term. The MACDH trough extends from September (where it is deepest) into October and, as I've written before, suggests further downside after a significant bounce. The primary positive stochastic divergence compares the mid-month closing low in October and the marginally lower closing lows early in November, with the clearly higher stochastic troughs. In fact, there is even a positive stochastic divergence between the two consecutively lower price troughs in October and the two consecutively higher stochastic troughs that accompany them. |
| The only thing, technically speaking, that stands in the way of a rally in March lumber futures is the 50-day moving average. While I like to use the 50-day exponential moving average (EMA), I tend to think of it as providing support and/or resistance only AFTER it has proven it can do so. So while I see the possibility of March lumber running into resistance near the 330 level, it appears that far more significant resistance exists at the 340 level, where the downwardly sloping consolidation from the second half of September might come into play. |
| Should the rally in March lumber -- currently four bullish days old -- show some follow-through, the double bottom formed by the October and November price troughs suggests that prices could rally above a breakout area between 330-325 to the 345-350 area. A rally that met stiff resistance at these levels would be consistent with the point made in the previous paragraph about the likely limits of any upside in March lumber. |
Technical Writer for Technical Analysis of STOCKS & COMMODITIES magazine, Working-Money.com, and Traders.com Advantage.
| Title: | Technical Writer |
| Company: | Technical Analysis, Inc. |
| Address: | 4757 California Avenue SW |
| Seattle, WA 98116 | |
| Phone # for sales: | 206 938 0570 |
| Fax: | 206 938 1307 |
| Website: | www.Traders.com |
| E-mail address: | DPenn@traders.com |
Traders' Resource Links | |
| Charting the Stock Market: The Wyckoff Method -- Books | |
| Working-Money.com -- Online Trading Services | |
| Traders.com Advantage -- Online Trading Services | |
| Technical Analysis of Stocks & Commodities -- Publications and Newsletters | |
| Working Money, at Working-Money.com -- Publications and Newsletters | |
| Traders.com Advantage -- Publications and Newsletters | |
| Professional Traders Starter Kit -- Software | |
Click here for more information about our publications!
Comments
Date: 11/13/04Rank: 3Comment:

|

Request Information From Our Sponsors
- VectorVest, Inc.
- Executive Premier Workshop
- One-Day Options Course
- OptionsPro
- Retirement Income Workshop
- Sure-Fire Trading Systems (VectorVest, Inc.)
- Trading as a Business Workshop
- VectorVest 7 EOD
- VectorVest 7 RealTime/IntraDay
- VectorVest AutoTester
- VectorVest Educational Services
- VectorVest OnLine
- VectorVest Options Analyzer
- VectorVest ProGraphics v6.0
- VectorVest ProTrader 7
- VectorVest RealTime Derby Tool
- VectorVest Simulator
- VectorVest Variator
- VectorVest Watchdog
- StockCharts.com, Inc.
- Candle Patterns
- Candlestick Charting Explained
- Intermarket Technical Analysis
- John Murphy on Chart Analysis
- John Murphy's Chart Pattern Recognition
- John Murphy's Market Message
- MurphyExplainsMarketAnalysis-Intermarket Analysis
- MurphyExplainsMarketAnalysis-Visual Analysis
- StockCharts.com
- Technical Analysis of the Financial Markets
- The Visual Investor
