

HOT TOPICS LIST
- MACD
- Fibonacci
- RSI
- Gann
- ADXR
- Stochastics
- Volume
- Triangles
- Futures
- Cycles
- Volatility
- ZIGZAG
- MESA
- Retracement
- Aroon
INDICATORS LIST
LIST OF TOPICS
PRINT THIS ARTICLE
by Chris Manuell
Oil has temporarily alleviated the recent overbought condition and inflationary concerns with a seasonal fall in October. It now appears poised for a resumption of the uptrend.
Position: N/A
Chris Manuell
Chris Manuell spent 7 years as a futures sales/trader for a large investment bank and more recently as a technical analyst for an independent research company. He has a bachelor of economics and graduate diploma in applied finance & investment. Currently enrolled in the CMT program with the MTA.
PRINT THIS ARTICLE
CANDLESTICK CHARTING
Light Crude Poised To Resume Uptrend
11/12/04 02:31:43 PMby Chris Manuell
Oil has temporarily alleviated the recent overbought condition and inflationary concerns with a seasonal fall in October. It now appears poised for a resumption of the uptrend.
Position: N/A
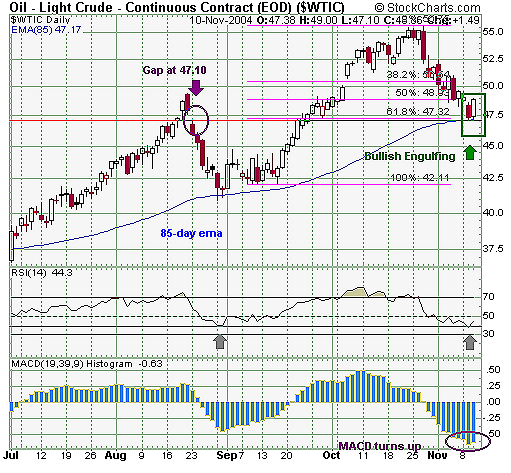
| Light crude completed a near-perfect bullish engulfing pattern on November 10, ironically on the day the Fed was brooding over interest rates and, more specifically, the direction of oil. The bullish engulfing pattern is a dual candlestick reversal pattern with the second white candle "engulfing" the body of the preceding dark candle after a decline. It marks a point where buying pressure overwhelms the sellers and tends to set reaction lows. Light crude opened on November10 at 47.10, although it was one cent above the prior close instead of below, and rallied to close higher than the previous sessions open. This marked a shift in the recent bearish stance and was a positive statement by bulls. |
| The bullish engulfing in light crude was reinforced by a confluence of support points. The low on November 10 at 47.10 was also a former gap, or in candlesticks parlance, a falling window, from August 23. The 85-day exponential moving average (EMA), which has proved a reliable measure of support on the primary uptrend -- halting the August decline -- again proved an obdurate level of support. This region also provided a 0.618 retracement support from the upswing from the support line at 42.11 to the October peak at 55.65. |
|
| Figure 1: Light crude daily chart |
| Graphic provided by: StockCharts.com. |
| |
| Oscillators are also supportive of a reassertion of the uptrend, with the RSI bouncing from the bullish support zone at 40 and the MACD histogram slope turning upward from a low level beneath the centerline. This should provide the impetus to support the bullish engulfing pattern and enable a challenge of the recent highs. |
| The low of the bullish engulfing pattern at 47.10 should also provide support in the near term, and a close below that level would negate the bullish engulfing pattern and suggest that a deeper correction is unfolding. I hope Alan Greenspan has been monitoring his candlestick patterns. |
Chris Manuell spent 7 years as a futures sales/trader for a large investment bank and more recently as a technical analyst for an independent research company. He has a bachelor of economics and graduate diploma in applied finance & investment. Currently enrolled in the CMT program with the MTA.
| E-mail address: | chrismanuell5@yahoo.co.uk |
Click here for more information about our publications!
Comments
Date:�11/13/04Rank:�3Comment:�
Date:�11/14/04Rank:�5Comment:�
Date:�11/16/04Rank:�5Comment:�

Request Information From Our Sponsors
- StockCharts.com, Inc.
- Candle Patterns
- Candlestick Charting Explained
- Intermarket Technical Analysis
- John Murphy on Chart Analysis
- John Murphy's Chart Pattern Recognition
- John Murphy's Market Message
- MurphyExplainsMarketAnalysis-Intermarket Analysis
- MurphyExplainsMarketAnalysis-Visual Analysis
- StockCharts.com
- Technical Analysis of the Financial Markets
- The Visual Investor
- VectorVest, Inc.
- Executive Premier Workshop
- One-Day Options Course
- OptionsPro
- Retirement Income Workshop
- Sure-Fire Trading Systems (VectorVest, Inc.)
- Trading as a Business Workshop
- VectorVest 7 EOD
- VectorVest 7 RealTime/IntraDay
- VectorVest AutoTester
- VectorVest Educational Services
- VectorVest OnLine
- VectorVest Options Analyzer
- VectorVest ProGraphics v6.0
- VectorVest ProTrader 7
- VectorVest RealTime Derby Tool
- VectorVest Simulator
- VectorVest Variator
- VectorVest Watchdog