HOT TOPICS LIST
- MACD
- Fibonacci
- RSI
- Gann
- ADXR
- Stochastics
- Volume
- Triangles
- Futures
- Cycles
- Volatility
- ZIGZAG
- MESA
- Retracement
- Aroon
INDICATORS LIST
LIST OF TOPICS
PRINT THIS ARTICLE
by David Penn
Is it time to empty the chamber on Cisco?
Position: N/A
David Penn
Technical Writer for Technical Analysis of STOCKS & COMMODITIES magazine, Working-Money.com, and Traders.com Advantage.
PRINT THIS ARTICLE
STOCHASTICS
The Cisco Kid's Gap Down Negative Divergence Special
11/11/04 08:27:07 AMby David Penn
Is it time to empty the chamber on Cisco?
Position: N/A
| In the immortal, lazy soul rock classic from the 1970s band War, Cisco Kid drank whiskey, ate salted peanuts and "rode the sunset." Thirty years later, the stock Cisco appears as if it may have had too much whiskey and developed a peanut allergy. I'm not talking about the Cisco, the bubble stock of the late 1990s. I'm talking about Cisco of late 2004, the stock that just gapped down on outsized volume after reporting that its second-quarter router sales were "lumpy." |
| I don't know what "lumpy" sales are, exactly. But investors acted as if they did, sending shares of Cisco down more than 6.5% on Wednesday. |

|
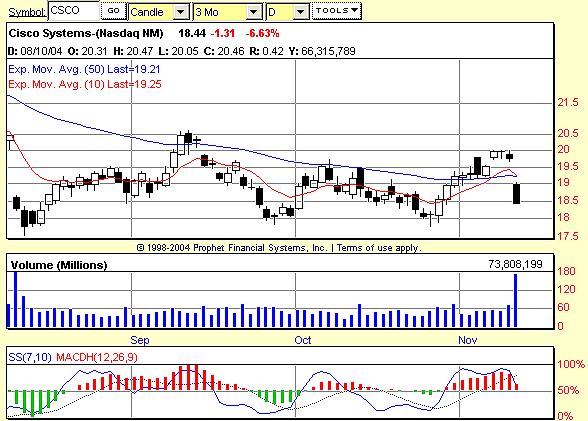
| Figure 1: Cisco Systems. Set up by a negative divergence between prices and the 7,10 stochastic, shares of Cisco tumbled on overwhelming volume one day later. |
| Graphic provided by: Prophet Financial, Inc. |
| |
| Cisco rallied above its 50-day exponential moving average (EMA) early in November, a generally positive and bullish indication. The October lows were slightly higher than the September low, another positive development. But at the same time, the November highs were clearly lower than the October highs. Lower highs and higher lows tend to suggest a triangle or, failing something so specific, a contraction in volatility. The only question was in what direction stock prices would be propelled once that contraction in volatility had run its course. |
| Here, our best guide might have been the 7,10 stochastic, which presented Cisco with a negative divergence in the first half of November. Note how sequentially higher price peaks in CSCO in early November are matched by sequentially lower stochastic peaks. While divergences like these can be defied for a period of time, they are always significant events, particularly if the peaks (or troughs, in the case of positive divergences) are well defined in both the price and the indicator. |
| An aggressive approach to the basic trading setup I've written about frequently in Traders.com Advantage and Working-Money.com would have noted a sell opportunity on November 9 as the moving average convergence/divergence histogram (MACDH) began to slope down ("downshift"). Again, this MACDH downshift is important in the context of the negative divergence. The other scenario in which a MACDH shift from moving up to moving down would be relevant to me would be if CSCO was trading under the 50-day EMA at the time of the shift. As for a specific entry target, half the range of that downshift day subtracted from the low of the downshift day called for a short entry near 19.50. As it turned out, CSCO opened on November 10 just under 19, gapping down from the previous day's close at 19.75. Coming so early in what could be CSCO's new downtrend -- and on overwhelming volume -- traders could be forgiven for seeing more downside ahead for the Cisco Kid. |
Technical Writer for Technical Analysis of STOCKS & COMMODITIES magazine, Working-Money.com, and Traders.com Advantage.
| Title: | Technical Writer |
| Company: | Technical Analysis, Inc. |
| Address: | 4757 California Avenue SW |
| Seattle, WA 98116 | |
| Phone # for sales: | 206 938 0570 |
| Fax: | 206 938 1307 |
| Website: | www.Traders.com |
| E-mail address: | DPenn@traders.com |
Traders' Resource Links | |
| Charting the Stock Market: The Wyckoff Method -- Books | |
| Working-Money.com -- Online Trading Services | |
| Traders.com Advantage -- Online Trading Services | |
| Technical Analysis of Stocks & Commodities -- Publications and Newsletters | |
| Working Money, at Working-Money.com -- Publications and Newsletters | |
| Traders.com Advantage -- Publications and Newsletters | |
| Professional Traders Starter Kit -- Software | |
Click here for more information about our publications!
Comments
Date: 11/11/04Rank: 3Comment:

|

Request Information From Our Sponsors
- StockCharts.com, Inc.
- Candle Patterns
- Candlestick Charting Explained
- Intermarket Technical Analysis
- John Murphy on Chart Analysis
- John Murphy's Chart Pattern Recognition
- John Murphy's Market Message
- MurphyExplainsMarketAnalysis-Intermarket Analysis
- MurphyExplainsMarketAnalysis-Visual Analysis
- StockCharts.com
- Technical Analysis of the Financial Markets
- The Visual Investor
- VectorVest, Inc.
- Executive Premier Workshop
- One-Day Options Course
- OptionsPro
- Retirement Income Workshop
- Sure-Fire Trading Systems (VectorVest, Inc.)
- Trading as a Business Workshop
- VectorVest 7 EOD
- VectorVest 7 RealTime/IntraDay
- VectorVest AutoTester
- VectorVest Educational Services
- VectorVest OnLine
- VectorVest Options Analyzer
- VectorVest ProGraphics v6.0
- VectorVest ProTrader 7
- VectorVest RealTime Derby Tool
- VectorVest Simulator
- VectorVest Variator
- VectorVest Watchdog
