HOT TOPICS LIST
- MACD
- Fibonacci
- RSI
- Gann
- ADXR
- Stochastics
- Volume
- Triangles
- Futures
- Cycles
- Volatility
- ZIGZAG
- MESA
- Retracement
- Aroon
INDICATORS LIST
LIST OF TOPICS
PRINT THIS ARTICLE
by Sean Moore
The on-balance volume (OBV) indicator provides an effective means for measuring cumulative volume as it relates to price.
Position: N/A
Sean Moore
Traders.com Staff Writer.
PRINT THIS ARTICLE
ON BALANCE VOLUME
Improve Timing With On-Balance Volume
06/02/00 10:08:12 AMby Sean Moore
The on-balance volume (OBV) indicator provides an effective means for measuring cumulative volume as it relates to price.
Position: N/A
| One of the most popular ways to chart cumulative volume is with the on-balance volume (OBV) indicator. This indicator, first introduced by Joseph Granville, has become a standard indicator for many analytical software packages because it helps to smooth volume data, and it uses both volume and price information. The OBV is calculated by adding or subtracting each day's volume to the OBV's cumulative total. If a security's price closes above the previous day's close, the volume is added to the OBV, and if the price closes lower it is subtracted. The OBV indicator can then be charted, usually with a line chart, alongside the daily price chart, offering some interesting comparisons. |
| When analyzing the OBV line, you should check to see if it is confirming (moving in the same direction), or diverging with the price line. If the price is trending upward, for example, and the OBV line is also moving upward, it indicates that volume is increasing in the direction of the trend. This is a positive signal, and if the two lines are diverging this is a forewarning that a trend reversal could be imminent. |

|
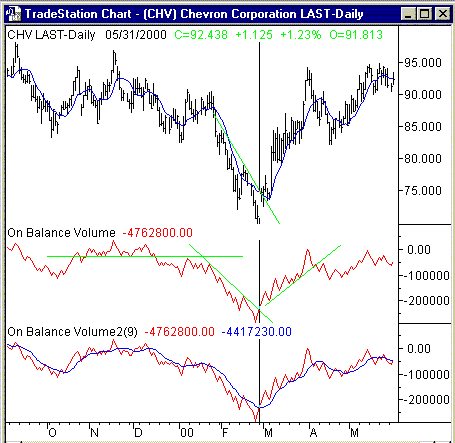
| Figure 1: The daily chart for Chevron Corporation (CHV) plotted with price. Below the bar chart are two OBV lines, the first using trendlines, and the lower showing a moving average. |
| Graphic provided by: TradeStation. |
| |
| You can incorporate many of the same techniques used for price analysis to the OBV. Similar to price analysis, if the OBV line breaks above or below a trendline or the moving average line, then a buy or sell signal is created. Sometimes the trend may be stronger on the OBV line than it is on the daily price chart. |
| Figure 1 shows the daily bar chart for Chevron Corporation [CHV] and also includes two OBV lines, the upper one showing trendlines and the bottom one showing a moving average. In this example, CHV's price and OBV lines are in sync. As the price breaks above its moving average line and resistance trendline, the OBV does also, confirming the price break. |
| When the OBV line and the price are both trending it is a sign that the volume is supporting the price trend. However, if the price is trending and the OBV line is flat, there is an indication that the price trend is losing strength. Watching the OBV trend can help increase confidence and improve timing. |
Traders.com Staff Writer.
| Title: | Project Engineer |
| Company: | Technical Analysis, Inc. |
| Address: | 4757 California Ave. SW |
| Seattle, WA 98116 | |
| Phone # for sales: | 206 938 0570 |
| Fax: | 206 938 1307 |
| Website: | Traders.com |
| E-mail address: | smoore@traders.com |
Traders' Resource Links | |
| Charting the Stock Market: The Wyckoff Method -- Books | |
| Working-Money.com -- Online Trading Services | |
| Traders.com Advantage -- Online Trading Services | |
| Technical Analysis of Stocks & Commodities -- Publications and Newsletters | |
| Working Money, at Working-Money.com -- Publications and Newsletters | |
| Traders.com Advantage -- Publications and Newsletters | |
| Professional Traders Starter Kit -- Software | |
Click here for more information about our publications!
Comments
Date: / /Rank: 1Comment:

|

Request Information From Our Sponsors
- StockCharts.com, Inc.
- Candle Patterns
- Candlestick Charting Explained
- Intermarket Technical Analysis
- John Murphy on Chart Analysis
- John Murphy's Chart Pattern Recognition
- John Murphy's Market Message
- MurphyExplainsMarketAnalysis-Intermarket Analysis
- MurphyExplainsMarketAnalysis-Visual Analysis
- StockCharts.com
- Technical Analysis of the Financial Markets
- The Visual Investor
- VectorVest, Inc.
- Executive Premier Workshop
- One-Day Options Course
- OptionsPro
- Retirement Income Workshop
- Sure-Fire Trading Systems (VectorVest, Inc.)
- Trading as a Business Workshop
- VectorVest 7 EOD
- VectorVest 7 RealTime/IntraDay
- VectorVest AutoTester
- VectorVest Educational Services
- VectorVest OnLine
- VectorVest Options Analyzer
- VectorVest ProGraphics v6.0
- VectorVest ProTrader 7
- VectorVest RealTime Derby Tool
- VectorVest Simulator
- VectorVest Variator
- VectorVest Watchdog
