HOT TOPICS LIST
- MACD
- Fibonacci
- RSI
- Gann
- ADXR
- Stochastics
- Volume
- Triangles
- Futures
- Cycles
- Volatility
- ZIGZAG
- MESA
- Retracement
- Aroon
INDICATORS LIST
LIST OF TOPICS
PRINT THIS ARTICLE
by David Penn
A major MACDH trough in the daily chart of December copper suggests lower prices to come. But first, a word from the countertrend bounce ...
Position: N/A
David Penn
Technical Writer for Technical Analysis of STOCKS & COMMODITIES magazine, Working-Money.com, and Traders.com Advantage.
PRINT THIS ARTICLE
MACD
The MACDH And Copper's Autumn Correction
11/10/04 09:20:31 AMby David Penn
A major MACDH trough in the daily chart of December copper suggests lower prices to come. But first, a word from the countertrend bounce ...
Position: N/A
| I've written elsewhere about the ability of the moving average convergence/divergence histogram (MACDH) troughs to anticipate subsequent price moves ("Symmetrical Triangles And The MACDH," Working-Money.com, March 24, 2004; "Post-Breakdown MACDH Extremes," Working-Money.com, May 19, 2004). To recap, the idea is that an extreme MACDH value -- positive or negative -- can portend future price moves in the direction of the extreme MACDH, typically after a countertrend move. If a major MACDH trough occurred during a price decline, then traders and investors could reasonably expect that, after a bounce of some degree, prices were likely to continue moving lower. |
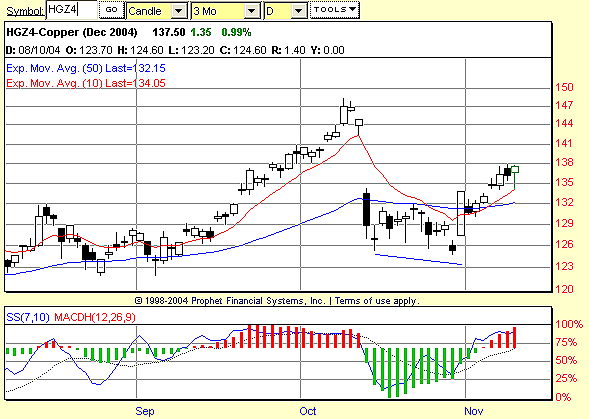
| The correction in December copper affords another opportunity to see major MACDH troughs at work. December copper (or HGZ4) made its closing high on October 8 at 146.95. The correction that followed was sharp and sudden, and prices three days later plummeted to a closing low of 128.80 -- a massive decline by any measure. |

|
| Figure 1: December copper. While the deep MACDH trough suggests lower prices ahead, the positive divergence between the 7,10 stochastic and the two October price troughs insists that a bounce up will come before any new breakdown. |
| Graphic provided by: Prophet Financial, Inc. |
| |
| During that decline, the MACDH formed a sizable trough. In fact, going back more than a year on the daily chart, we can see there is no more severely negative MACDH trough in December copper. This is enough to qualify the current MACDH trough as an "extreme." As such, we should expect two developments: a significant price rebound and, subsequent to that, fresh new lows (that is, beyond the low of the initial correction). |
| The first development already appears to be well under way. December copper rallied from its correction low near 126 to just under 138 in about eight or nine days. Not only was this bounce telegraphed by the general nature of MACDH extremes, but also there is a clear positive divergence between the two, sequentially lower October price troughs in December copper and the two, sequentially higher troughs in the 7,10 stochastic. |
| How much higher will copper futures rally? Given the gap between, roughly 141 and 135, it would not be surprising in the slightest to see the current bounce in copper manage to close the gap with its own close above 141. In addition, if we measure the consolidation range from mid-October to late October -- the consolidation range prices broke through strongly on October 29 -- then we find that the value of that range (9.45) added to the value at the breakout level (approximately 131) gives us a minimum projected upside of about 140.45. |
Technical Writer for Technical Analysis of STOCKS & COMMODITIES magazine, Working-Money.com, and Traders.com Advantage.
| Title: | Technical Writer |
| Company: | Technical Analysis, Inc. |
| Address: | 4757 California Avenue SW |
| Seattle, WA 98116 | |
| Phone # for sales: | 206 938 0570 |
| Fax: | 206 938 1307 |
| Website: | www.Traders.com |
| E-mail address: | DPenn@traders.com |
Traders' Resource Links | |
| Charting the Stock Market: The Wyckoff Method -- Books | |
| Working-Money.com -- Online Trading Services | |
| Traders.com Advantage -- Online Trading Services | |
| Technical Analysis of Stocks & Commodities -- Publications and Newsletters | |
| Working Money, at Working-Money.com -- Publications and Newsletters | |
| Traders.com Advantage -- Publications and Newsletters | |
| Professional Traders Starter Kit -- Software | |
Click here for more information about our publications!
Comments
Date: 11/10/04Rank: 3Comment:

Request Information From Our Sponsors
- StockCharts.com, Inc.
- Candle Patterns
- Candlestick Charting Explained
- Intermarket Technical Analysis
- John Murphy on Chart Analysis
- John Murphy's Chart Pattern Recognition
- John Murphy's Market Message
- MurphyExplainsMarketAnalysis-Intermarket Analysis
- MurphyExplainsMarketAnalysis-Visual Analysis
- StockCharts.com
- Technical Analysis of the Financial Markets
- The Visual Investor
- VectorVest, Inc.
- Executive Premier Workshop
- One-Day Options Course
- OptionsPro
- Retirement Income Workshop
- Sure-Fire Trading Systems (VectorVest, Inc.)
- Trading as a Business Workshop
- VectorVest 7 EOD
- VectorVest 7 RealTime/IntraDay
- VectorVest AutoTester
- VectorVest Educational Services
- VectorVest OnLine
- VectorVest Options Analyzer
- VectorVest ProGraphics v6.0
- VectorVest ProTrader 7
- VectorVest RealTime Derby Tool
- VectorVest Simulator
- VectorVest Variator
- VectorVest Watchdog
