HOT TOPICS LIST
- MACD
- Fibonacci
- RSI
- Gann
- ADXR
- Stochastics
- Volume
- Triangles
- Futures
- Cycles
- Volatility
- ZIGZAG
- MESA
- Retracement
- Aroon
INDICATORS LIST
LIST OF TOPICS
PRINT THIS ARTICLE
by David Penn
All the post-hoc stock and election analysis you'll need is summed up in one chart and two stochastic divergences.
Position: N/A
David Penn
Technical Writer for Technical Analysis of STOCKS & COMMODITIES magazine, Working-Money.com, and Traders.com Advantage.
PRINT THIS ARTICLE
STOCHASTICS
Divergences And The Bush Bounce
11/09/04 02:47:20 PMby David Penn
All the post-hoc stock and election analysis you'll need is summed up in one chart and two stochastic divergences.
Position: N/A
| In an article for Working-Money.com ("Election 2004: A Tale Of Two Tops," October 6, 2004), I observed that the Presidential elections in both 2000 and 2004 were occurring during bearish trading ranges that developed at the end of significant market rallies. This bearishness notwithstanding, I wrote that -- in a nutshell -- Senator John Kerry needed the market to move lower going into the election in order to win. While a crash wasn't necessary, the longer the market stayed within striking distance of breakeven for the year, the longer were the odds that Senator Long Face would make it to the White House. |
| So in all of the post-election analysis you hear about Presidential leadership, or "moral issues," or exit polls, you probably won't hear the one thing that really cost John Kerry the Presidency: a double positive stochastic divergence that marked a significant bottom on Monday, |

|
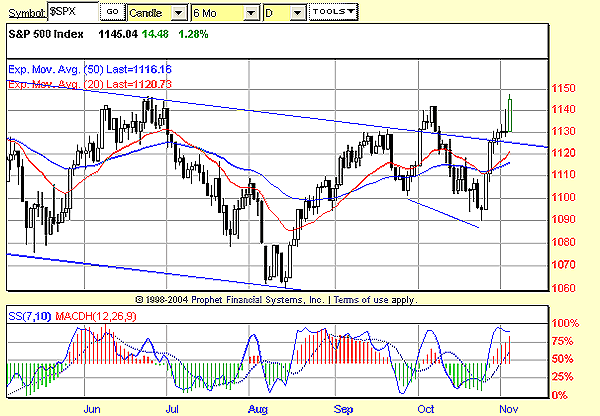
| Figure 1: S&P 500. Both the lows in August and October were anticipated by sizable (or "running") positive divergences in the 7,10 stochastic. |
| Graphic provided by: Prophet Financial, Inc. |
| |
| The month-to-month positive divergence between the consecutively lower late September and late October price troughs and the consecutively higher stochastic troughs were a major sign that a turnaround was likely in late October. A shorter-term positive divergence between the consecutively lower mid-October and late October price troughs and the consecutively higher stochastic troughs at the same time only added to the bullish portents of price and indicator action leading up to the Presidential election. |
| Stochastic divergences with the 7,10 stochastic can run for some time before they are resolved. Consider the running positive stochastic divergences in the July/August timeframe. It wasn't until the final, short-term positive divergence in early to mid-August that the nonconfirmation was resolved to the upside. This, among other things, suggests that traders and investors might want to look elsewhere for a specific entry signal, however clear an opportunity a positive (or negative) divergence may present. |
| In the case of the October positive divergence, traders and investors had an additional bonus in the form of a hammer candlestick -- a candlestick that often augurs reversal when it appears at the end of a significant downtrend. A similar reversal by way of a hammer candlestick took place in mid- to late July, producing a five-day, 20-odd point bounce. The most recent hammer in late October is co-responsible for a seven-day, 50-odd point rally, to say nothing of the reelection of President Bush. |
Technical Writer for Technical Analysis of STOCKS & COMMODITIES magazine, Working-Money.com, and Traders.com Advantage.
| Title: | Technical Writer |
| Company: | Technical Analysis, Inc. |
| Address: | 4757 California Avenue SW |
| Seattle, WA 98116 | |
| Phone # for sales: | 206 938 0570 |
| Fax: | 206 938 1307 |
| Website: | www.Traders.com |
| E-mail address: | DPenn@traders.com |
Traders' Resource Links | |
| Charting the Stock Market: The Wyckoff Method -- Books | |
| Working-Money.com -- Online Trading Services | |
| Traders.com Advantage -- Online Trading Services | |
| Technical Analysis of Stocks & Commodities -- Publications and Newsletters | |
| Working Money, at Working-Money.com -- Publications and Newsletters | |
| Traders.com Advantage -- Publications and Newsletters | |
| Professional Traders Starter Kit -- Software | |
Click here for more information about our publications!
Comments
Date: 11/10/04Rank: 3Comment:
Date: 12/23/04Rank: 5Comment:

Request Information From Our Sponsors
- StockCharts.com, Inc.
- Candle Patterns
- Candlestick Charting Explained
- Intermarket Technical Analysis
- John Murphy on Chart Analysis
- John Murphy's Chart Pattern Recognition
- John Murphy's Market Message
- MurphyExplainsMarketAnalysis-Intermarket Analysis
- MurphyExplainsMarketAnalysis-Visual Analysis
- StockCharts.com
- Technical Analysis of the Financial Markets
- The Visual Investor
- VectorVest, Inc.
- Executive Premier Workshop
- One-Day Options Course
- OptionsPro
- Retirement Income Workshop
- Sure-Fire Trading Systems (VectorVest, Inc.)
- Trading as a Business Workshop
- VectorVest 7 EOD
- VectorVest 7 RealTime/IntraDay
- VectorVest AutoTester
- VectorVest Educational Services
- VectorVest OnLine
- VectorVest Options Analyzer
- VectorVest ProGraphics v6.0
- VectorVest ProTrader 7
- VectorVest RealTime Derby Tool
- VectorVest Simulator
- VectorVest Variator
- VectorVest Watchdog
