HOT TOPICS LIST
- MACD
- Fibonacci
- RSI
- Gann
- ADXR
- Stochastics
- Volume
- Triangles
- Futures
- Cycles
- Volatility
- ZIGZAG
- MESA
- Retracement
- Aroon
INDICATORS LIST
LIST OF TOPICS
PRINT THIS ARTICLE
by Chris Manuell
The Gold and Silver Index has produced a stealth-like rally from early May this year; is its luster fading?
Position: N/A
Chris Manuell
Chris Manuell spent 7 years as a futures sales/trader for a large investment bank and more recently as a technical analyst for an independent research company. He has a bachelor of economics and graduate diploma in applied finance & investment. Currently enrolled in the CMT program with the MTA.
PRINT THIS ARTICLE
CANDLESTICK CHARTING
Petrifying Pattern In Gold & Silver Index
11/09/04 09:11:03 AMby Chris Manuell
The Gold and Silver Index has produced a stealth-like rally from early May this year; is its luster fading?
Position: N/A
| The Gold and Silver Index is currently approaching its yearly highs. However, unlike gold and the surrogate gold vehicle, the euro, the index may not reach those highs in the near term. Silver is still clawing its way back toward its February capitulation highs and is providing drag on the Gold and Silver Index. |
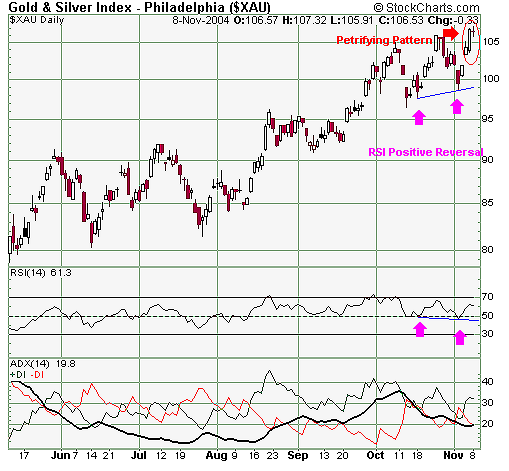
| The Gold and Silver Index recently completed a positive reversal in the relative strength index (RSI); this method was discovered by Andrew Cardwell and is elaborated by Constance Brown in her book TECHNICAL ANALYSIS FOR THE TRADING PROFESSIONAL. The method allows us to determine price objectives for a specific market. A positive reversal signal emerges when the RSI develops a lower low, while the price is making a correspondingly higher high -- a polite way of saying the indicator is on the wrong side of the tracks. XAU recently completed a positive signal on November 2 and projected a target of 107.08. Having met the positive reversal target on November 8, briefly surpassing it with a high of 107.32, the trader can be on watch for any potential price reversal signals. |

|
| Figure 1: Gold & Silver Index, daily chart |
| Graphic provided by: StockCharts.com. |
| |
| The Gold and Silver Index completed a doji on November 8; the doji marks a period of indecision and hesitation with the close and opening for the session in very close proximity. The doji is particularly good at calling tops and reflects an inability of bulls to sustain their buying momentum. This particular doji has an extra dimension -- its body was contained within the long white real body of the previous session -- thus making it a bearish harami. The harami is similar to the inside day from bar chart analysis, except that just the body of the candle needs to be captured inside the prior session, not the entire range. The Japanese suggest that the harami is a sign that the market is "losing its breath." The fact that this bearish harami is also a doji has even greater implications -- the diminutive second real body illustrates greater ambivalence -- akin to a triathlete running up a hill with the finish line in sight. A doji preceded by a long white body is labeled a harami cross, or in Japanese parlance, a petrifying pattern. The petrifying pattern could stall the XAU rally in the near term and allow for the market to regain its breath. |
Chris Manuell spent 7 years as a futures sales/trader for a large investment bank and more recently as a technical analyst for an independent research company. He has a bachelor of economics and graduate diploma in applied finance & investment. Currently enrolled in the CMT program with the MTA.
| E-mail address: | chrismanuell5@yahoo.co.uk |
Click here for more information about our publications!
Comments
Date: 11/10/04Rank: 4Comment:

Request Information From Our Sponsors
- StockCharts.com, Inc.
- Candle Patterns
- Candlestick Charting Explained
- Intermarket Technical Analysis
- John Murphy on Chart Analysis
- John Murphy's Chart Pattern Recognition
- John Murphy's Market Message
- MurphyExplainsMarketAnalysis-Intermarket Analysis
- MurphyExplainsMarketAnalysis-Visual Analysis
- StockCharts.com
- Technical Analysis of the Financial Markets
- The Visual Investor
- VectorVest, Inc.
- Executive Premier Workshop
- One-Day Options Course
- OptionsPro
- Retirement Income Workshop
- Sure-Fire Trading Systems (VectorVest, Inc.)
- Trading as a Business Workshop
- VectorVest 7 EOD
- VectorVest 7 RealTime/IntraDay
- VectorVest AutoTester
- VectorVest Educational Services
- VectorVest OnLine
- VectorVest Options Analyzer
- VectorVest ProGraphics v6.0
- VectorVest ProTrader 7
- VectorVest RealTime Derby Tool
- VectorVest Simulator
- VectorVest Variator
- VectorVest Watchdog
