HOT TOPICS LIST
- MACD
- Fibonacci
- RSI
- Gann
- ADXR
- Stochastics
- Volume
- Triangles
- Futures
- Cycles
- Volatility
- ZIGZAG
- MESA
- Retracement
- Aroon
INDICATORS LIST
LIST OF TOPICS
PRINT THIS ARTICLE
by Kevin Hopson
Given support at slightly lower levels and a potentially bullish consolidation pattern, investors should continue to hold these shares.
Position: Hold
Kevin Hopson
Kevin has been a technical analyst for roughly 10 years now. Previously, Kevin owned his own business and acted as a registered investment advisor, specializing in energy. He was also a freelance oil analyst for Orient Trading Co., a commodity futures trading firm in Japan. Kevin is currently a freelance writer.
PRINT THIS ARTICLE
REV HEAD & SHOULDERS
A Reverse Head-And-Shoulders Pattern For Brigham Exploration?
11/09/04 09:01:25 AMby Kevin Hopson
Given support at slightly lower levels and a potentially bullish consolidation pattern, investors should continue to hold these shares.
Position: Hold
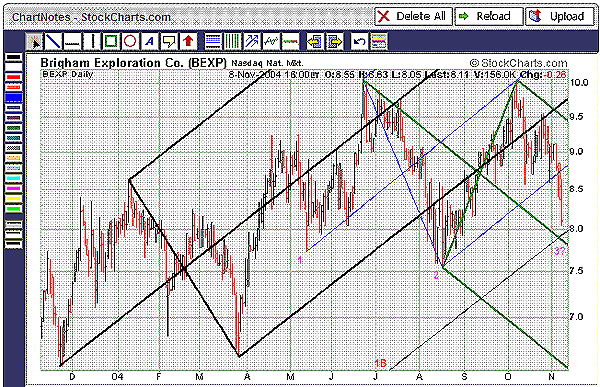
| Brigham Exploration (BEXP) has seen its stock price decline significantly after forming a double top in early October. For example, if you look at the one-year chart, you will see that Brigham recently broke support along the bottom parallel line of the blue pitchfork. Prices had been contained within the lower half of this pitchfork since August. As a result, it is no surprise that prices proceeded to sell off after this technical breakdown. |
| However, the stock is quickly approaching a key support area. More specifically, if you take the distance from the black median line to the upper/lower parallel line and stretch it to the right of the pitchfork, you create another channel line. This channel line (1B) has converged right around the $8.00 level and should act as near-term support for the stock. Also coming into play here is the green median line, which should lend support at slightly lower levels ($7.80). As a result, Brigham could see a short-term bounce in the $7.80 to $8.00 range. |

|
| Figure 1: Brigham Exploration |
| Graphic provided by: StockCharts.com. |
| |
| In the meantime, a reverse head-and-shoulders pattern looks to be developing, as illustrated by the three pivot points. For example, pivot point 1 represents the left shoulder, while pivot point 2 represents the head. The third pivot point is a projection of the right shoulder. If Brigham can bounce off support in the $7.80 to $8.00 range and move higher, a reverse head-and-shoulders pattern will likely be confirmed. Since this formation tends to be a long-term continuation (or short-term bottoming) pattern, it would be bullish for the stock. As a result, I would continue to hold shares of Brigham Exploration and await further developments. |
Kevin has been a technical analyst for roughly 10 years now. Previously, Kevin owned his own business and acted as a registered investment advisor, specializing in energy. He was also a freelance oil analyst for Orient Trading Co., a commodity futures trading firm in Japan. Kevin is currently a freelance writer.
| Glen Allen, VA | |
| E-mail address: | hopson_1@yahoo.com |
Click here for more information about our publications!
Comments
Date: 11/10/04Rank: 2Comment:

Request Information From Our Sponsors
- StockCharts.com, Inc.
- Candle Patterns
- Candlestick Charting Explained
- Intermarket Technical Analysis
- John Murphy on Chart Analysis
- John Murphy's Chart Pattern Recognition
- John Murphy's Market Message
- MurphyExplainsMarketAnalysis-Intermarket Analysis
- MurphyExplainsMarketAnalysis-Visual Analysis
- StockCharts.com
- Technical Analysis of the Financial Markets
- The Visual Investor
- VectorVest, Inc.
- Executive Premier Workshop
- One-Day Options Course
- OptionsPro
- Retirement Income Workshop
- Sure-Fire Trading Systems (VectorVest, Inc.)
- Trading as a Business Workshop
- VectorVest 7 EOD
- VectorVest 7 RealTime/IntraDay
- VectorVest AutoTester
- VectorVest Educational Services
- VectorVest OnLine
- VectorVest Options Analyzer
- VectorVest ProGraphics v6.0
- VectorVest ProTrader 7
- VectorVest RealTime Derby Tool
- VectorVest Simulator
- VectorVest Variator
- VectorVest Watchdog
