

HOT TOPICS LIST
- MACD
- Fibonacci
- RSI
- Gann
- ADXR
- Stochastics
- Volume
- Triangles
- Futures
- Cycles
- Volatility
- ZIGZAG
- MESA
- Retracement
- Aroon
INDICATORS LIST
LIST OF TOPICS
PRINT THIS ARTICLE
by Chris Manuell
The five-year US Treasury note often represents a good barometer for the US yield curve and recently completed a double bottom, suggestive of higher yields.
Position: N/A
Chris Manuell
Chris Manuell spent 7 years as a futures sales/trader for a large investment bank and more recently as a technical analyst for an independent research company. He has a bachelor of economics and graduate diploma in applied finance & investment. Currently enrolled in the CMT program with the MTA.
PRINT THIS ARTICLE
DOUBLE BOTTOMS
Five-Year Note Double Bottom
11/08/04 08:22:01 AMby Chris Manuell
The five-year US Treasury note often represents a good barometer for the US yield curve and recently completed a double bottom, suggestive of higher yields.
Position: N/A
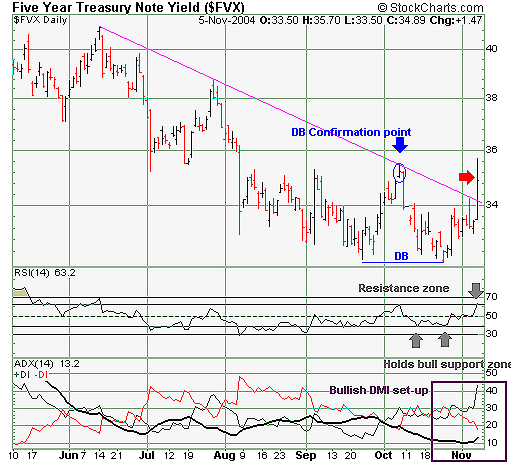
| The five-year US Treasury note recorded six-month lows on September 23 with a low of 32.12 and subsequently bounced to the tentative trendline from the June highs; that third touch on October 8 confirmed the trendline. The market then retraced from the trendline and resumed the move lower before stalling at 32.05 on October 26. The minimum time requirement of a month was satisfied and the second trough was very close to the first trough. The intervening minor high at October 7 at 35.49 becomes the confirmation point. The success rate of these patterns is extremely high upon waiting for a price move above the confirmation point. |
| Price action from the five-year note on November 5 delivered an important directional statement, breaching the double bottom confirmation point and also the bearish trendline from June. A minimum objective can be calculated from the pattern by taking the height of the double bottom and adding that to the confirmation point. This provides a minimum objective of 38.93 for the five-year note (35.49 - 32.05 + 35.49). |
|
| Figure 1: Daily chart five-year note Treasury yield |
| Graphic provided by: StockCharts.com. |
| |
| The relative strength index (RSI) has also recently displayed resilience and bottoming characteristics with its reluctance to move below the 40 region, which is a support zone in a bull market and warns the trader that a trend change may be in the offing. A sustained move by the RSI toward the 75 region would confirm this. The directional movement index (DMI) is also poised for a big directional move, as the average directional movement index (ADX) has turned up from a low level while remaining below its directional lines. The +DMI remains above the -DMI, which is a sign that a new trend is about to commence and validates the double-bottom formation. |
| Traders should also remain cognizant of failed chart patterns, which can be considered among the most reliable of all chart patterns. The failure of the market to close above the confirmation point was a caveat. A failure of the five-year note to remain above the bearish trendline would also mark a rejection of the double-bottom formation and a sharp move lower, and reassertion of the downtrend would be assured. Conservative traders could wait for three consecutive closes above the trendline to confirm the change in trend. |
Chris Manuell spent 7 years as a futures sales/trader for a large investment bank and more recently as a technical analyst for an independent research company. He has a bachelor of economics and graduate diploma in applied finance & investment. Currently enrolled in the CMT program with the MTA.
| E-mail address: | chrismanuell5@yahoo.co.uk |
Click here for more information about our publications!
Comments
Date:�11/10/04Rank:�3Comment:�

Request Information From Our Sponsors
- StockCharts.com, Inc.
- Candle Patterns
- Candlestick Charting Explained
- Intermarket Technical Analysis
- John Murphy on Chart Analysis
- John Murphy's Chart Pattern Recognition
- John Murphy's Market Message
- MurphyExplainsMarketAnalysis-Intermarket Analysis
- MurphyExplainsMarketAnalysis-Visual Analysis
- StockCharts.com
- Technical Analysis of the Financial Markets
- The Visual Investor
- VectorVest, Inc.
- Executive Premier Workshop
- One-Day Options Course
- OptionsPro
- Retirement Income Workshop
- Sure-Fire Trading Systems (VectorVest, Inc.)
- Trading as a Business Workshop
- VectorVest 7 EOD
- VectorVest 7 RealTime/IntraDay
- VectorVest AutoTester
- VectorVest Educational Services
- VectorVest OnLine
- VectorVest Options Analyzer
- VectorVest ProGraphics v6.0
- VectorVest ProTrader 7
- VectorVest RealTime Derby Tool
- VectorVest Simulator
- VectorVest Variator
- VectorVest Watchdog