HOT TOPICS LIST
- MACD
- Fibonacci
- RSI
- Gann
- ADXR
- Stochastics
- Volume
- Triangles
- Futures
- Cycles
- Volatility
- ZIGZAG
- MESA
- Retracement
- Aroon
INDICATORS LIST
LIST OF TOPICS
PRINT THIS ARTICLE
by Kevin Hopson
There are four stocks in the oil services industry that you will want to keep an eye on in the near term.
Position: Accumulate
Kevin Hopson
Kevin has been a technical analyst for roughly 10 years now. Previously, Kevin owned his own business and acted as a registered investment advisor, specializing in energy. He was also a freelance oil analyst for Orient Trading Co., a commodity futures trading firm in Japan. Kevin is currently a freelance writer.
PRINT THIS ARTICLE
TECHNICAL ANALYSIS
A Few Good Setups In The Oil Patch
11/08/04 12:27:43 PMby Kevin Hopson
There are four stocks in the oil services industry that you will want to keep an eye on in the near term.
Position: Accumulate
| I have pounded the table on oil service stocks in the last several months, saying that higher prices are likely there in the long term. My view has not changed in recent days, as pessimistic market sentiment still points to a continuation of the current uptrend. For example, despite a significant rally in the Oil Services Index (OSX) during September, market sentiment remains negative. More specifically, short interest for OSX component companies rose 1.61% in October to 106.0 million shares. This equates to a short interest ratio of 3.79x. Though this is not a substantial increase from September, the fact that short interest failed to decline during the recent rally is bullish. The reason is that significant tops tend to develop when market sentiment is at its highest (or most bullish). This obviously has not been the case for the OSX. |
| Because the index has proceeded to pull back the last few weeks, I decided to take a look at high short-interest stocks with the best potential buy setups. I came up with the following companies: Transocean Inc. (RIG); Baker Hughes Inc. (BHI); Weatherford Int'l (WFT); and Tidewater Inc. (TDW). If you look at Transocean, which has a short interest ratio of 4.23x, the stock has a nice confluence of support around the $34.00 level. For example, note how the bottom parallel line of the black pitchfork, the bottom channel line, and the stock's 50-day moving average ($33.99) have all converged here. If Transocean (Figure 1) pulls back to the 34.00 level, it could be an excellent buying opportunity. |

|
| Figure 1: Transocean Sedco Forex |
| Graphic provided by: StockCharts.com. |
| |
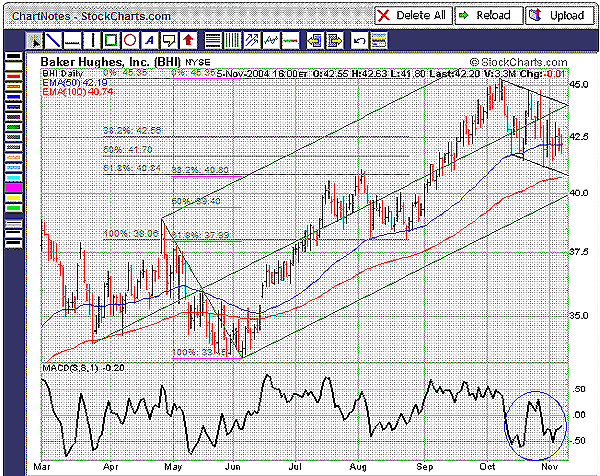
If you turn your attention to Baker Hughes (Figure 2), which has a short interest ratio of 5.76x (the highest of all companies in the index), you will see a different situation developing. Instead of trading in a sideways channel (or trading range), Baker Hughes has been stuck in a falling channel formation. Note how the bottom channel line is converging around the stock's 100-day moving average ($40.74). In addition, the 38.2% retracement level ($40.80) from the June to October rally and the 61.8% retracement level ($40.84) from the August to October rally line up right around this level. Further, the moving average convergence/divergence (MACD) has been putting in higher lows despite the recent pullback, which is bullish. As a result, buying on a pullback to the $40.75 to $40.85 range could prove advantageous. Figure 2: Baker Hughes |
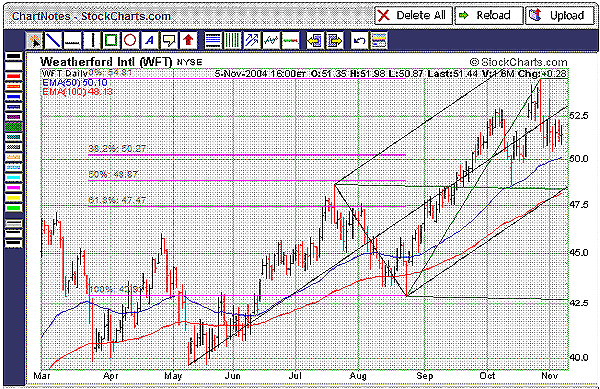
Next on the list is Weatherford International, which has a short interest ratio of 4.92x. This stock has a couple of potential buy zones, the first being the $50.00 level. This is the site of the stock's 50-day moving average ($50.10) and the 38.2% retracement level ($50.27) from the August to October rally. Another good support area is the $47.50 to $49.00 range. This is the site of the 50% ($48.87) and 61.8% ($47.47) retracement levels from the May to October rally, as well as the stock's 100-day moving average ($48.13). In addition, the green median line and bottom black parallel line come into play here. As a result, the $47.50 to $49.00 range should act as ultimate support for the stock. Figure 3: Weatherford International |
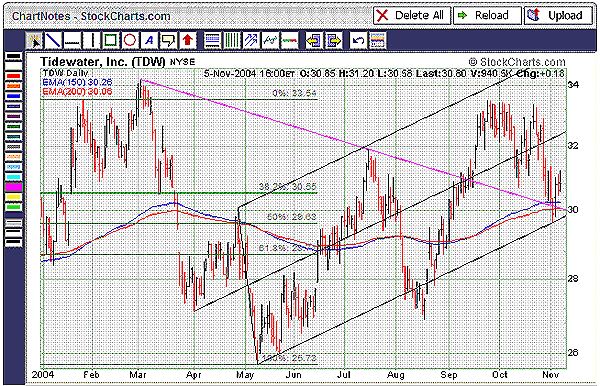
Last but not least is Tidewater, which has a short interest ratio of 4.76x. Note how the stock recently bounced of key support around the $30.00 level. More specifically, this is the site of the bottom black parallel line, March's former downtrend line, the 50% retracement level ($29.63) from the May to September rally and the stock's 150-day ($30.26) and 200-day ($30.06) moving averages. Because the stock is trading right above these support levels, buying at current (or slightly lower) prices is favorable from a risk/reward standpoint. In summary, I would look for a pullback in these four stocks -- to the specified support levels -- as a solid buying opportunity, as prices are likely headed higher in the long term. Figure 4: Tidewater |
Kevin has been a technical analyst for roughly 10 years now. Previously, Kevin owned his own business and acted as a registered investment advisor, specializing in energy. He was also a freelance oil analyst for Orient Trading Co., a commodity futures trading firm in Japan. Kevin is currently a freelance writer.
| Glen Allen, VA | |
| E-mail address: | hopson_1@yahoo.com |
Click here for more information about our publications!
PRINT THIS ARTICLE

Request Information From Our Sponsors
- StockCharts.com, Inc.
- Candle Patterns
- Candlestick Charting Explained
- Intermarket Technical Analysis
- John Murphy on Chart Analysis
- John Murphy's Chart Pattern Recognition
- John Murphy's Market Message
- MurphyExplainsMarketAnalysis-Intermarket Analysis
- MurphyExplainsMarketAnalysis-Visual Analysis
- StockCharts.com
- Technical Analysis of the Financial Markets
- The Visual Investor
- VectorVest, Inc.
- Executive Premier Workshop
- One-Day Options Course
- OptionsPro
- Retirement Income Workshop
- Sure-Fire Trading Systems (VectorVest, Inc.)
- Trading as a Business Workshop
- VectorVest 7 EOD
- VectorVest 7 RealTime/IntraDay
- VectorVest AutoTester
- VectorVest Educational Services
- VectorVest OnLine
- VectorVest Options Analyzer
- VectorVest ProGraphics v6.0
- VectorVest ProTrader 7
- VectorVest RealTime Derby Tool
- VectorVest Simulator
- VectorVest Variator
- VectorVest Watchdog
