HOT TOPICS LIST
- MACD
- Fibonacci
- RSI
- Gann
- ADXR
- Stochastics
- Volume
- Triangles
- Futures
- Cycles
- Volatility
- ZIGZAG
- MESA
- Retracement
- Aroon
INDICATORS LIST
LIST OF TOPICS
PRINT THIS ARTICLE
by Chris Manuell
Wal-Mart joined in the re-election euphoria to complete a very reliable reversal pattern -- the double bottom.
Position: Buy
Chris Manuell
Chris Manuell spent 7 years as a futures sales/trader for a large investment bank and more recently as a technical analyst for an independent research company. He has a bachelor of economics and graduate diploma in applied finance & investment. Currently enrolled in the CMT program with the MTA.
PRINT THIS ARTICLE
DOUBLE BOTTOMS
Wal-Mart Completes Double Bottom
11/05/04 08:37:18 AMby Chris Manuell
Wal-Mart joined in the re-election euphoria to complete a very reliable reversal pattern -- the double bottom.
Position: Buy
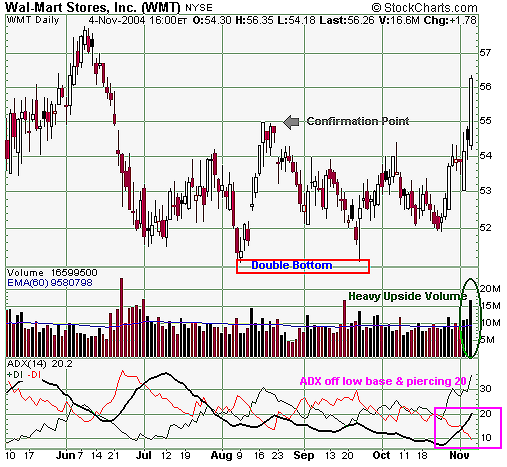
| Wal-Mart demonstrated bottoming characteristics in late September when an attempt to record fresh yearly lows was met with contempt in the shape of a hammer. ("Hammering Out A Potential Double Bottom With Wal-Mart," Traders.com Advantage, 9/29/04). The bullish hammer reinforced the inability of the market to breach the 51.08 low set on August 9, and thus setting up a potential double bottom. |
| Wal-Mart completed the double-bottom formation with a close above the confirmation point -- the peak between the two troughs -- at 54.97. This breakout was also corroborated by an exceptional volume session -- the highest upside volume session since February. Again, patience is the key to these patterns as their success rate improves dramatically on awaiting confirmation. In ENCYCLOPEDIA OF CHART PATTERNS, Thomas Bulkowski points out that the failure rate of these patterns falls to just 3% with a valid confirmation. Taking the height of the pattern and projecting that from the confirmation point, 54.97, gives a target of 58.86, which allows us to determine a minimum objective for Wal-Mart. |

|
| Figure 1: Wal-Mart daily chart |
| Graphic provided by: StockCharts.com. |
| |
| Bulls should also take solace from the average directional moving index (ADX), which turned up from an extreme low and also pierced its confirmation point, the 20 level. Markets tend to enter a strong trend once the ADX moves from a low base and cross that level. |
Chris Manuell spent 7 years as a futures sales/trader for a large investment bank and more recently as a technical analyst for an independent research company. He has a bachelor of economics and graduate diploma in applied finance & investment. Currently enrolled in the CMT program with the MTA.
| E-mail address: | chrismanuell5@yahoo.co.uk |
Click here for more information about our publications!
Comments
Date: 11/10/04Rank: 4Comment:

Request Information From Our Sponsors
- VectorVest, Inc.
- Executive Premier Workshop
- One-Day Options Course
- OptionsPro
- Retirement Income Workshop
- Sure-Fire Trading Systems (VectorVest, Inc.)
- Trading as a Business Workshop
- VectorVest 7 EOD
- VectorVest 7 RealTime/IntraDay
- VectorVest AutoTester
- VectorVest Educational Services
- VectorVest OnLine
- VectorVest Options Analyzer
- VectorVest ProGraphics v6.0
- VectorVest ProTrader 7
- VectorVest RealTime Derby Tool
- VectorVest Simulator
- VectorVest Variator
- VectorVest Watchdog
- StockCharts.com, Inc.
- Candle Patterns
- Candlestick Charting Explained
- Intermarket Technical Analysis
- John Murphy on Chart Analysis
- John Murphy's Chart Pattern Recognition
- John Murphy's Market Message
- MurphyExplainsMarketAnalysis-Intermarket Analysis
- MurphyExplainsMarketAnalysis-Visual Analysis
- StockCharts.com
- Technical Analysis of the Financial Markets
- The Visual Investor
