HOT TOPICS LIST
- MACD
- Fibonacci
- RSI
- Gann
- ADXR
- Stochastics
- Volume
- Triangles
- Futures
- Cycles
- Volatility
- ZIGZAG
- MESA
- Retracement
- Aroon
INDICATORS LIST
LIST OF TOPICS
PRINT THIS ARTICLE
by David Penn
When volatility has been running high, an early morning contraction can lead to explosive results.
Position: N/A
David Penn
Technical Writer for Technical Analysis of STOCKS & COMMODITIES magazine, Working-Money.com, and Traders.com Advantage.
PRINT THIS ARTICLE
TRIANGLES
Trading An Intraday Triangle
11/08/04 08:34:10 AMby David Penn
When volatility has been running high, an early morning contraction can lead to explosive results.
Position: N/A
| Triangles have become my favorite chart pattern over the last few days and weeks. This is not the case for everyone, I recognize. Head and shoulders patterns may be the king of technical patterns. And experienced traders will take flags, wedges, and pennants in a strong trend whenever they can get them. But of late, triangles have seduced me with their simplicity. And a symmetrical triangle that developed early in Thursday morning's December emini S&P session was yet another case in point. |
| By volatility, I don't mean the $VIX, which has sunk dramatically in the wake of President Bush's reelection victory. I simply refer to the powerful bounce the markets have experienced since late October. As I've written recently ("Divergences And The Bush Bounce"), this move higher was anticipated by a whole gaggle of technical factors, from candlestick patterns to oscillator divergences. And as such, its staying power is difficult to fade, as market bears have learned to their despair. |

|
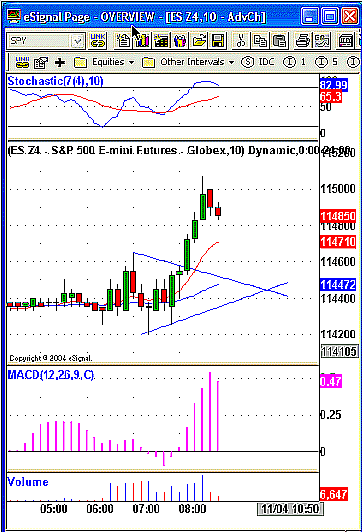
| Figure 1: An early session breakout from this symmetrical triangle nevertheless boosted the December emini S&P 500 to its price objective north of 1150. |
| Graphic provided by: eSignal. |
| |
| It's gotten to the point where as soon as I see the kind of intrabar shadows to the upside followed a few bars later by intrabar shadows to the downside pattern developing, I start thinking triangle. And while I'm very willing to let a triangle setup go if the pattern of lower highs and higher lows is broken, I am no less willing to accept a breakout that arrives a little sooner than it should (or later, in some instances). The triangle breakout in this 10-minute chart has a number of virtues. The most obvious one is the increase in volume on the breakout bar (I'm using bar and candlestick more or less interchangeably here) shortly after 8 am. The support provided by the 10- and 50-bar exponential moving averages is also helpful for the upside breakout. Note that once prices broke free from the triangle, the 10-bar EMA provided an effective support level for the entirety of the ride up. |
| I've written a bit about the entry trigger I use, which involves shifts in the moving average convergence/divergence histogram (MACDH). Not all software packages provide a true histogram; most do, but every now and then I'll run into a quality package that nonetheless creates a histogram out of the longer of the two moving averages instead of a true histogram that reflects the waxing and waning difference between the two moving averages of the MACD. |
| In any event, the shift upward in the MACDH that took place between 7:40 and 8:00 am alerted me to a long entry opportunity at 1146.50. That entry was triggered with the 8:20-8:30 am bar. If you've read our "At the Close" column in Technical Analysis of STOCKS & COMMODITIES magazine (written by our editor, Jayanthi Gopalakrishnan), then you'll know that two-point targets are pretty popular around here as far as intraday emini S&P trades are concerned, and two points were all that was desired out of this Thursday morning symmetrical triangle breakout. Given the size of the triangle - -a tick over four points -- and a breakout at 1146, it seemed as if the move to 1150 would provide plenty of cover for taking the money at + 2 points (that is, 1148.50) and going. |
Technical Writer for Technical Analysis of STOCKS & COMMODITIES magazine, Working-Money.com, and Traders.com Advantage.
| Title: | Technical Writer |
| Company: | Technical Analysis, Inc. |
| Address: | 4757 California Avenue SW |
| Seattle, WA 98116 | |
| Phone # for sales: | 206 938 0570 |
| Fax: | 206 938 1307 |
| Website: | www.Traders.com |
| E-mail address: | DPenn@traders.com |
Traders' Resource Links | |
| Charting the Stock Market: The Wyckoff Method -- Books | |
| Working-Money.com -- Online Trading Services | |
| Traders.com Advantage -- Online Trading Services | |
| Technical Analysis of Stocks & Commodities -- Publications and Newsletters | |
| Working Money, at Working-Money.com -- Publications and Newsletters | |
| Traders.com Advantage -- Publications and Newsletters | |
| Professional Traders Starter Kit -- Software | |
Click here for more information about our publications!
Comments
Date: 11/09/04Rank: 4Comment:
Date: 11/10/04Rank: 3Comment:

|

Request Information From Our Sponsors
- VectorVest, Inc.
- Executive Premier Workshop
- One-Day Options Course
- OptionsPro
- Retirement Income Workshop
- Sure-Fire Trading Systems (VectorVest, Inc.)
- Trading as a Business Workshop
- VectorVest 7 EOD
- VectorVest 7 RealTime/IntraDay
- VectorVest AutoTester
- VectorVest Educational Services
- VectorVest OnLine
- VectorVest Options Analyzer
- VectorVest ProGraphics v6.0
- VectorVest ProTrader 7
- VectorVest RealTime Derby Tool
- VectorVest Simulator
- VectorVest Variator
- VectorVest Watchdog
- StockCharts.com, Inc.
- Candle Patterns
- Candlestick Charting Explained
- Intermarket Technical Analysis
- John Murphy on Chart Analysis
- John Murphy's Chart Pattern Recognition
- John Murphy's Market Message
- MurphyExplainsMarketAnalysis-Intermarket Analysis
- MurphyExplainsMarketAnalysis-Visual Analysis
- StockCharts.com
- Technical Analysis of the Financial Markets
- The Visual Investor
