HOT TOPICS LIST
- MACD
- Fibonacci
- RSI
- Gann
- ADXR
- Stochastics
- Volume
- Triangles
- Futures
- Cycles
- Volatility
- ZIGZAG
- MESA
- Retracement
- Aroon
INDICATORS LIST
LIST OF TOPICS
PRINT THIS ARTICLE
by Chris Manuell
The Dow Jones industrials completed a weekly key reversal last week, which may support the seasonal bottom that often occurs in October.
Position: N/A
Chris Manuell
Chris Manuell spent 7 years as a futures sales/trader for a large investment bank and more recently as a technical analyst for an independent research company. He has a bachelor of economics and graduate diploma in applied finance & investment. Currently enrolled in the CMT program with the MTA.
PRINT THIS ARTICLE
REVERSAL
The DJIA's Weekly Key Reversal
11/03/04 11:23:35 AMby Chris Manuell
The Dow Jones industrials completed a weekly key reversal last week, which may support the seasonal bottom that often occurs in October.
Position: N/A
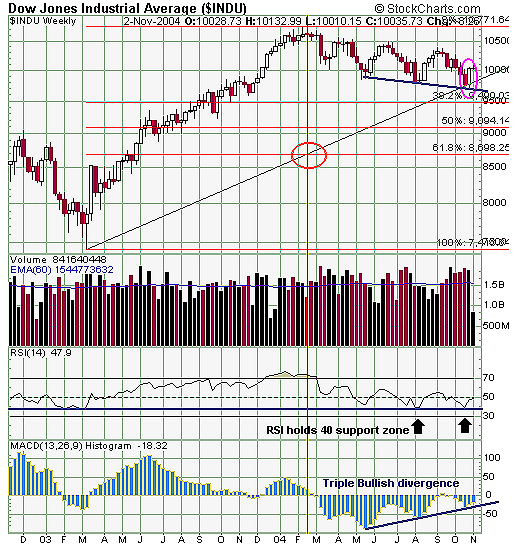
| The Dow industrials has recently been running its own race and has not had the support of its fellow indexes, diverging from its running mates, the Dow transports and Dow utilities, to move lower. I was a victim of the "sucker vote," as I said in my recent Traders.com Advantage article, "Dow Donuts Or Doughnuts," expecting a sustained downmove. The Dow industrials moved to yearly lows last week; however, the move was rejected and the market reversed sharply to end the week higher. A bullish weekly reversal was completed, consisting of a lower weekly low and a higher weekly high with a close above the prior week's high. In candlestick analysis, it also completed a bullish engulfing pattern, which resulted in the white body "engulfing" the dark one from the prior week at the end of the downtrend. These reversal patterns take on greater significance, as they were present on a weekly time frame. Volume also plays a supporting role, and the key reversal was validated with weekly volume remaining above the 60-week exponential moving average (EMA). |
| The Dow industrials encountered support at the third Fibonacci fanline on the weekly charts. The Fibonacci fanline is similar in appearance and application to the speedline. Trendlines are drawn from the extreme low in the case of the Dow industrials, and intersect the Fibonacci levels and the corresponding vertical line, which is taken from the extreme high of the rally. The orange circle on the weekly charts illustrates this intersection point. The rally from the Dow industrials at this 61.8 fanline suggests that the correction from March 2003 to February 2004 may have ended. This would support the seasonals in that the November to January period is the strongest three-month span for the stock market. |

|
| Figure 1: Weekly DJIA chart |
| Graphic provided by: StockCharts.com. |
| |
| Weekly oscillators on the Dow industrials also have showed signs that momentum may be diminishing. The failure of bears to penetrate the bullish lower zone of the weekly relative strength index (RSI) in the 40 region and the triple bullish divergence on the weekly MACD histogram also adds weight to the bullish argument in the near term. |
Chris Manuell spent 7 years as a futures sales/trader for a large investment bank and more recently as a technical analyst for an independent research company. He has a bachelor of economics and graduate diploma in applied finance & investment. Currently enrolled in the CMT program with the MTA.
| E-mail address: | chrismanuell5@yahoo.co.uk |
Click here for more information about our publications!
Comments
Date: 11/04/04Rank: 3Comment:
Date: 11/09/04Rank: 5Comment:
Date: 11/09/04Rank: 5Comment:

Request Information From Our Sponsors
- StockCharts.com, Inc.
- Candle Patterns
- Candlestick Charting Explained
- Intermarket Technical Analysis
- John Murphy on Chart Analysis
- John Murphy's Chart Pattern Recognition
- John Murphy's Market Message
- MurphyExplainsMarketAnalysis-Intermarket Analysis
- MurphyExplainsMarketAnalysis-Visual Analysis
- StockCharts.com
- Technical Analysis of the Financial Markets
- The Visual Investor
- VectorVest, Inc.
- Executive Premier Workshop
- One-Day Options Course
- OptionsPro
- Retirement Income Workshop
- Sure-Fire Trading Systems (VectorVest, Inc.)
- Trading as a Business Workshop
- VectorVest 7 EOD
- VectorVest 7 RealTime/IntraDay
- VectorVest AutoTester
- VectorVest Educational Services
- VectorVest OnLine
- VectorVest Options Analyzer
- VectorVest ProGraphics v6.0
- VectorVest ProTrader 7
- VectorVest RealTime Derby Tool
- VectorVest Simulator
- VectorVest Variator
- VectorVest Watchdog
