HOT TOPICS LIST
- MACD
- Fibonacci
- RSI
- Gann
- ADXR
- Stochastics
- Volume
- Triangles
- Futures
- Cycles
- Volatility
- ZIGZAG
- MESA
- Retracement
- Aroon
INDICATORS LIST
LIST OF TOPICS
PRINT THIS ARTICLE
by Chris Manuell
The euro recently escaped from a confined trading range with a sharp move higher, confirming the breakout, and is now pausing for breath.
Position: N/A
Chris Manuell
Chris Manuell spent 7 years as a futures sales/trader for a large investment bank and more recently as a technical analyst for an independent research company. He has a bachelor of economics and graduate diploma in applied finance & investment. Currently enrolled in the CMT program with the MTA.
PRINT THIS ARTICLE
FLAGS AND PENNANTS
Euro At Half-Mast
11/03/04 11:12:30 AMby Chris Manuell
The euro recently escaped from a confined trading range with a sharp move higher, confirming the breakout, and is now pausing for breath.
Position: N/A
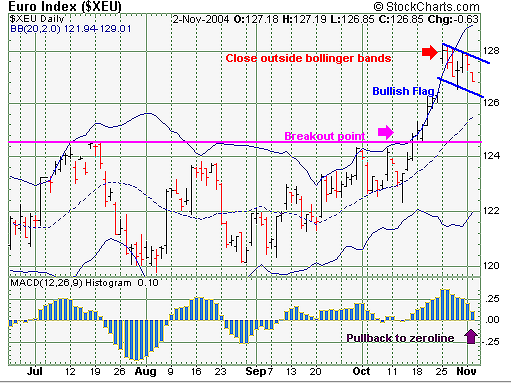
| The euro managed to break the shackles of resistance in the 124.50 region and enjoyed a sharp thrust higher, culminating in a close outside the Bollinger Band on October 25. Bollinger Bands are two bands that are located above and below a moving average at a distance of two standard deviations. This enables the bands to capture 95% of the price data and allows them to be used as support and resistance levels. A close outside the bands indicates that the market has become overexuberant and is vulnerable to a correction. The euro has since corrected from the move outside the band, and traders looking for a resumption of the uptrend would be looking in the vicinity of the middle band or 20-day moving average (MA) to provide support where they can add to long positions. |
| The euro has also developed a flag the common continuation pattern. The flag represents a pause in an existing dynamic price move, which is preceded by a sharp thrust higher. Flags tend to "fly half-mast from a flag pole" as they emerge at the halfway mark of a move and enable a price projection to be calculated. Measuring the distance from the breakout point in the euro at approximately 124.60 to the start of the flag at 128.15 gives a difference of 3.55. Prices should move at least this amount from the completion of the formation, which would set up a challenge of the highs of the euro. |

|
| Figure 1: Euro index daily chart |
| Graphic provided by: StockCharts.com. |
| |
| The moving average convergence/divergence (MACD) histogram can also help identify points where the market will find support; the histogram often finds support at the zero line as the moving averages converge. A move to the zero line in uptrends often presents traders with a good buying opportunity. |
Chris Manuell spent 7 years as a futures sales/trader for a large investment bank and more recently as a technical analyst for an independent research company. He has a bachelor of economics and graduate diploma in applied finance & investment. Currently enrolled in the CMT program with the MTA.
| E-mail address: | chrismanuell5@yahoo.co.uk |
Click here for more information about our publications!
Comments
Date: 11/04/04Rank: 3Comment:
Date: 11/09/04Rank: 5Comment:

Request Information From Our Sponsors
- VectorVest, Inc.
- Executive Premier Workshop
- One-Day Options Course
- OptionsPro
- Retirement Income Workshop
- Sure-Fire Trading Systems (VectorVest, Inc.)
- Trading as a Business Workshop
- VectorVest 7 EOD
- VectorVest 7 RealTime/IntraDay
- VectorVest AutoTester
- VectorVest Educational Services
- VectorVest OnLine
- VectorVest Options Analyzer
- VectorVest ProGraphics v6.0
- VectorVest ProTrader 7
- VectorVest RealTime Derby Tool
- VectorVest Simulator
- VectorVest Variator
- VectorVest Watchdog
- StockCharts.com, Inc.
- Candle Patterns
- Candlestick Charting Explained
- Intermarket Technical Analysis
- John Murphy on Chart Analysis
- John Murphy's Chart Pattern Recognition
- John Murphy's Market Message
- MurphyExplainsMarketAnalysis-Intermarket Analysis
- MurphyExplainsMarketAnalysis-Visual Analysis
- StockCharts.com
- Technical Analysis of the Financial Markets
- The Visual Investor
