

HOT TOPICS LIST
- MACD
- Fibonacci
- RSI
- Gann
- ADXR
- Stochastics
- Volume
- Triangles
- Futures
- Cycles
- Volatility
- ZIGZAG
- MESA
- Retracement
- Aroon
INDICATORS LIST
LIST OF TOPICS
PRINT THIS ARTICLE
by David Penn
A narrowing price range after a brief autumn correction locates lean hog futures at the crossroads.
Position: N/A
David Penn
Technical Writer for Technical Analysis of STOCKS & COMMODITIES magazine, Working-Money.com, and Traders.com Advantage.
PRINT THIS ARTICLE
TRIANGLES
Triangle Trouble For December Hogs?
10/28/04 01:16:17 PMby David Penn
A narrowing price range after a brief autumn correction locates lean hog futures at the crossroads.
Position: N/A
| One of the best explanations of how and why chart patterns work in technical analysis comes from TheStreet.com's Gary Smith. I remember years ago reading how patterns in price action are no different from patterns in other aspects of human behavior, such as driving automobiles. How many times have we spotted a driver and through no great act of precognition knew that the driver wasn't paying attention and was likely to cut you off, or run a red light or suddenly switch lanes without signaling? |
| Because after hundreds or even thousands of miles driven year after year, observant drivers become experts of knowing what behavior tends to lead to other behavior. We recognize the patterns. Sure, not every time does the slow, erratic driver turn out to be wielding a cellphone or a cheeseburger. Nor does the car hurtling toward the yellow light always go slashing through the intersection as the light turns red. But it happens often enough for us to know that it is better to err on the side of caution when our roadway antennae picks up a familiar pattern. |
|
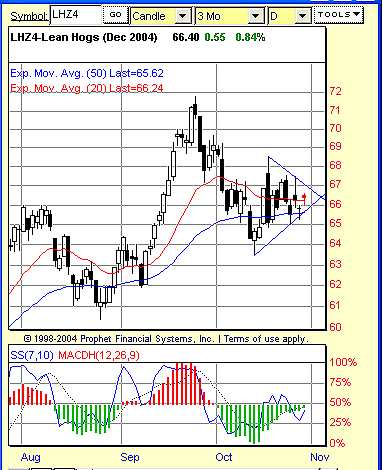
| Figure 1: An upside breakout from this symmetrical triangle could set up a test of the September highs. A downside breakdown would likely set up a showdown with the August lows. |
| Graphic provided by: Prophet Financial, Inc. |
| |
| I think of the commonness of patterns when I look at the symmetrical triangle that appears to have developed during the autumn correction in the December lean hogs contract. December lean hogs (LHZ4) have enjoyed a multimonth bull market that extends back to December 2003. And while it is difficult to determine whether the September highs represent the peak of this bull market in LHZ4, the growing consolidation near the intermediate-term moving averages is the reason for hog bulls (?!) to be wary of a breakdown that could wipe out two months' worth of gains. |
| All a symmetrical triangle represents is a contraction in price, a symmetrical contraction with higher lows and lower highs. Those familiar with volatility breakout trading setups and systems recognize that this contraction is what makes triangles special patterns to spot. The contraction of such triangles often is resolved with an explosive break from the contraction, much like the release of a coiled spring. Unlike many other technical chart patterns, the symmetrical triangle graphically shows the analyst or trader the amount of contraction taking place, making triangles among the more commonsensical chart patterns around. |
| What can traders expect when the "coiled spring" in December lean hogs is sprung? Without getting into some of the clues that can help determine direction (see my Working Money article "Symmetrical Triangles And The MACDH," March 24, 2004). Given the size of the triangle of between four and five points, and a likely breakout/breakdown at about 66, a move up to the 70-71 area or a move down to the 61-62 area are the most reasonable price targets, should prices break free of the pattern in the next day or two. |
Technical Writer for Technical Analysis of STOCKS & COMMODITIES magazine, Working-Money.com, and Traders.com Advantage.
| Title: | Technical Writer |
| Company: | Technical Analysis, Inc. |
| Address: | 4757 California Avenue SW |
| Seattle, WA 98116 | |
| Phone # for sales: | 206 938 0570 |
| Fax: | 206 938 1307 |
| Website: | www.Traders.com |
| E-mail address: | DPenn@traders.com |
Traders' Resource Links | |
| Charting the Stock Market: The Wyckoff Method -- Books | |
| Working-Money.com -- Online Trading Services | |
| Traders.com Advantage -- Online Trading Services | |
| Technical Analysis of Stocks & Commodities -- Publications and Newsletters | |
| Working Money, at Working-Money.com -- Publications and Newsletters | |
| Traders.com Advantage -- Publications and Newsletters | |
| Professional Traders Starter Kit -- Software | |
Click here for more information about our publications!
Comments
Date:�10/28/04Rank:�3Comment:�
Date:�11/02/04Rank:�5Comment:�
Date:�11/09/04Rank:�5Comment:�

Request Information From Our Sponsors
- StockCharts.com, Inc.
- Candle Patterns
- Candlestick Charting Explained
- Intermarket Technical Analysis
- John Murphy on Chart Analysis
- John Murphy's Chart Pattern Recognition
- John Murphy's Market Message
- MurphyExplainsMarketAnalysis-Intermarket Analysis
- MurphyExplainsMarketAnalysis-Visual Analysis
- StockCharts.com
- Technical Analysis of the Financial Markets
- The Visual Investor
- VectorVest, Inc.
- Executive Premier Workshop
- One-Day Options Course
- OptionsPro
- Retirement Income Workshop
- Sure-Fire Trading Systems (VectorVest, Inc.)
- Trading as a Business Workshop
- VectorVest 7 EOD
- VectorVest 7 RealTime/IntraDay
- VectorVest AutoTester
- VectorVest Educational Services
- VectorVest OnLine
- VectorVest Options Analyzer
- VectorVest ProGraphics v6.0
- VectorVest ProTrader 7
- VectorVest RealTime Derby Tool
- VectorVest Simulator
- VectorVest Variator
- VectorVest Watchdog